Fig. 4
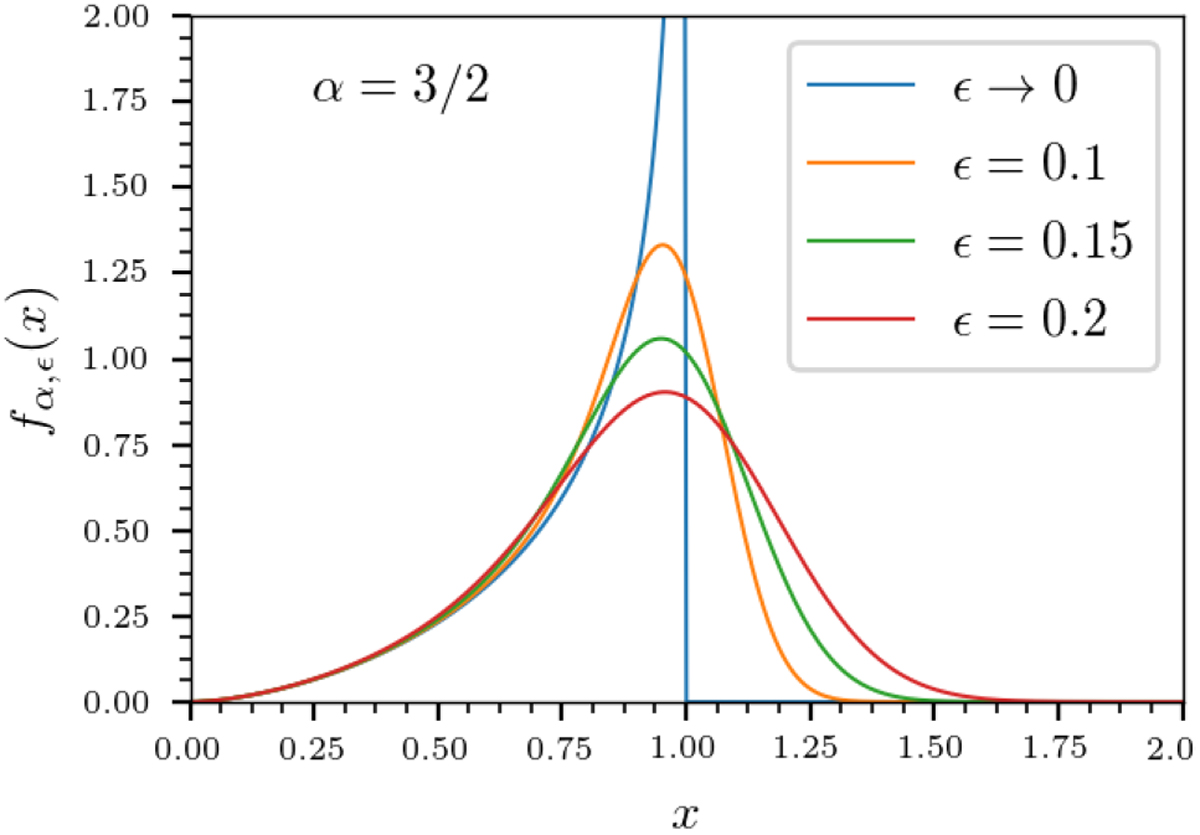
Function fα,ϵ(x) for α = 3∕2 with ϵ values similar to those obtained empirically. It is observed that for ϵ ≤ 0.2 the function peaks around x = 1, corresponding to the TH limit, while the broadening around x = 1 on the left side of the peak is similar for all ϵ. The difference between using the BP19 phenomenology or TH is more pronounced on the right side of the peak, affecting small frequencies.
Current usage metrics show cumulative count of Article Views (full-text article views including HTML views, PDF and ePub downloads, according to the available data) and Abstracts Views on Vision4Press platform.
Data correspond to usage on the plateform after 2015. The current usage metrics is available 48-96 hours after online publication and is updated daily on week days.
Initial download of the metrics may take a while.