Fig. 3
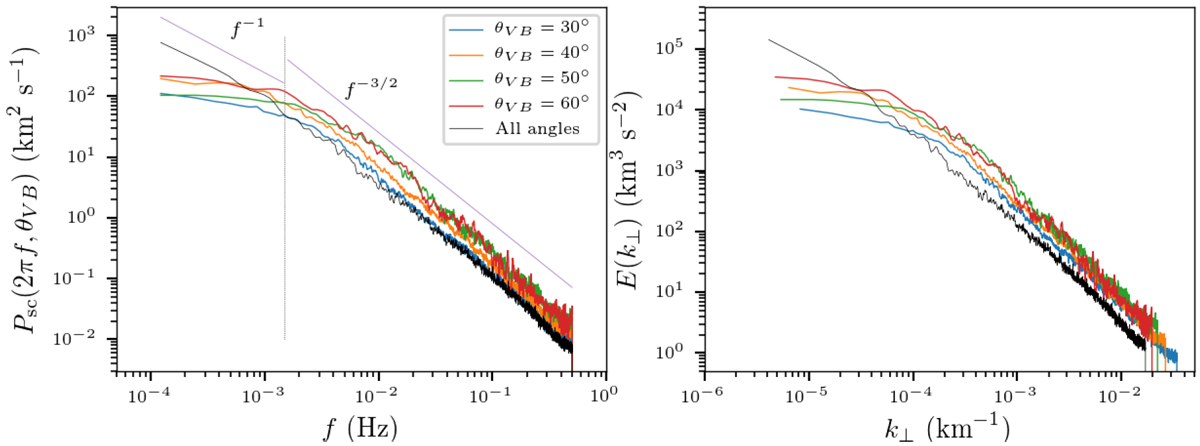
Left: frequency spectrum of magnetic fluctuations Psc(ω, θVB) for angles θVB = 30°, 40°, 50°, and 60° corresponding to interval E4, as well as the full spectrum irrespective of the angle. The spectral break between the 1∕f and f−3∕2 ranges for the unconditioned spectrum (black line) is found approximately (by inspection) at fb ≈ 2 × 10⁻³ Hz, indicated by the vertical dotted line. Right: spatial energy spectrum of magnetic fluctuations E(k⊥) reconstructed from the frequency spectra Psc(ω, θVB) for each sampling angle as well as by using the standard TH (black line).
Current usage metrics show cumulative count of Article Views (full-text article views including HTML views, PDF and ePub downloads, according to the available data) and Abstracts Views on Vision4Press platform.
Data correspond to usage on the plateform after 2015. The current usage metrics is available 48-96 hours after online publication and is updated daily on week days.
Initial download of the metrics may take a while.