Fig. 2
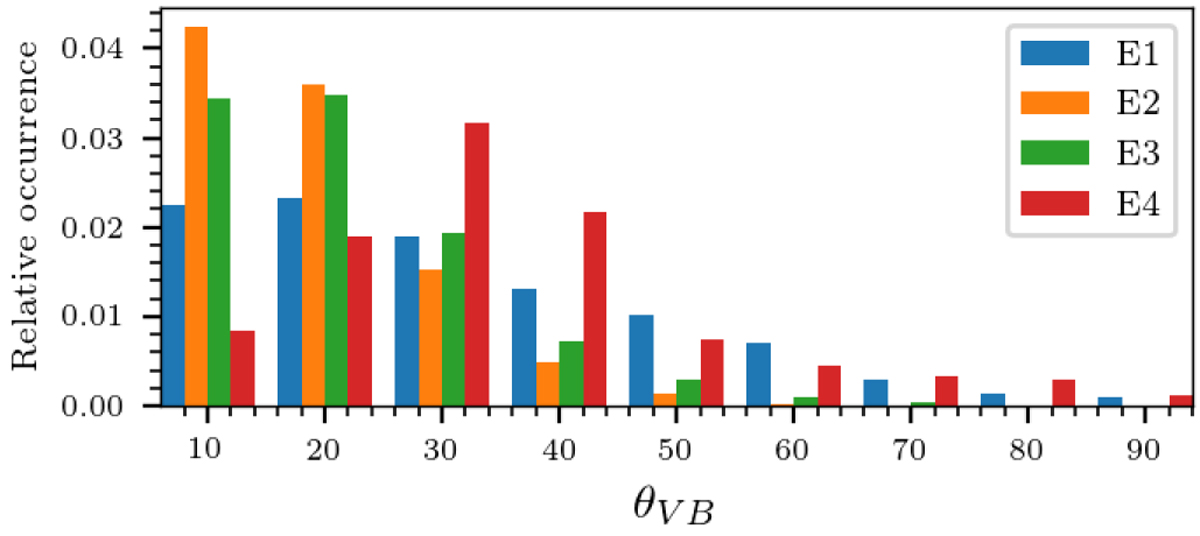
Normalized histograms showing the distribution of the sampling angle θVB defined in Eq. (10) for selected 24 h intervals, one for each encounter from E1 to E4. The histograms indicate that for the selected intervals, small sampling angles have the highest occurrence, indicating that the spacecraft is often traveling nearly parallel to the local magnetic field. However, sampling angles above the critical angles shown in Table 1 occur more than 50% of the time.
Current usage metrics show cumulative count of Article Views (full-text article views including HTML views, PDF and ePub downloads, according to the available data) and Abstracts Views on Vision4Press platform.
Data correspond to usage on the plateform after 2015. The current usage metrics is available 48-96 hours after online publication and is updated daily on week days.
Initial download of the metrics may take a while.