Fig. 1
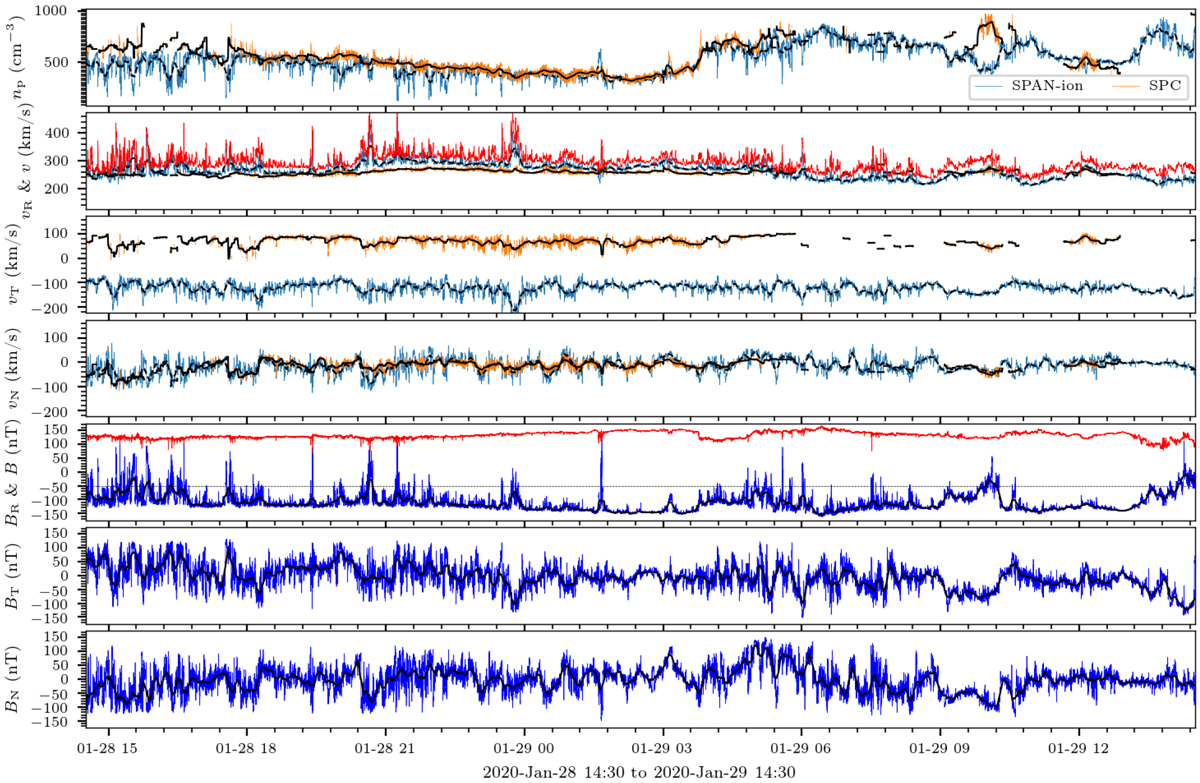
24 h PSP interval between 2020 Jan 28 at 14:30 and 2020 Jan 29 at 14:30. Top panel: proton number density as measured by both SPC and SPAN-ion. Second to fourth panels: (from top to bottom) bulk plasma velocity in the radial (R), tangential (T), and normal (N) directions, respectively. Three bottom panels: R, T, and N components of the magnetic field. The red line in the second and fifth panels represents the solar wind speed and the magnitude of the magnetic field, respectively. During encounter E4, due to the high PSP’s high speed at perihelion, a larger fraction of solar wind particles fall under SPAN-ion’s than on SPC’s field-of-view (FOV).
Current usage metrics show cumulative count of Article Views (full-text article views including HTML views, PDF and ePub downloads, according to the available data) and Abstracts Views on Vision4Press platform.
Data correspond to usage on the plateform after 2015. The current usage metrics is available 48-96 hours after online publication and is updated daily on week days.
Initial download of the metrics may take a while.