Fig. 3
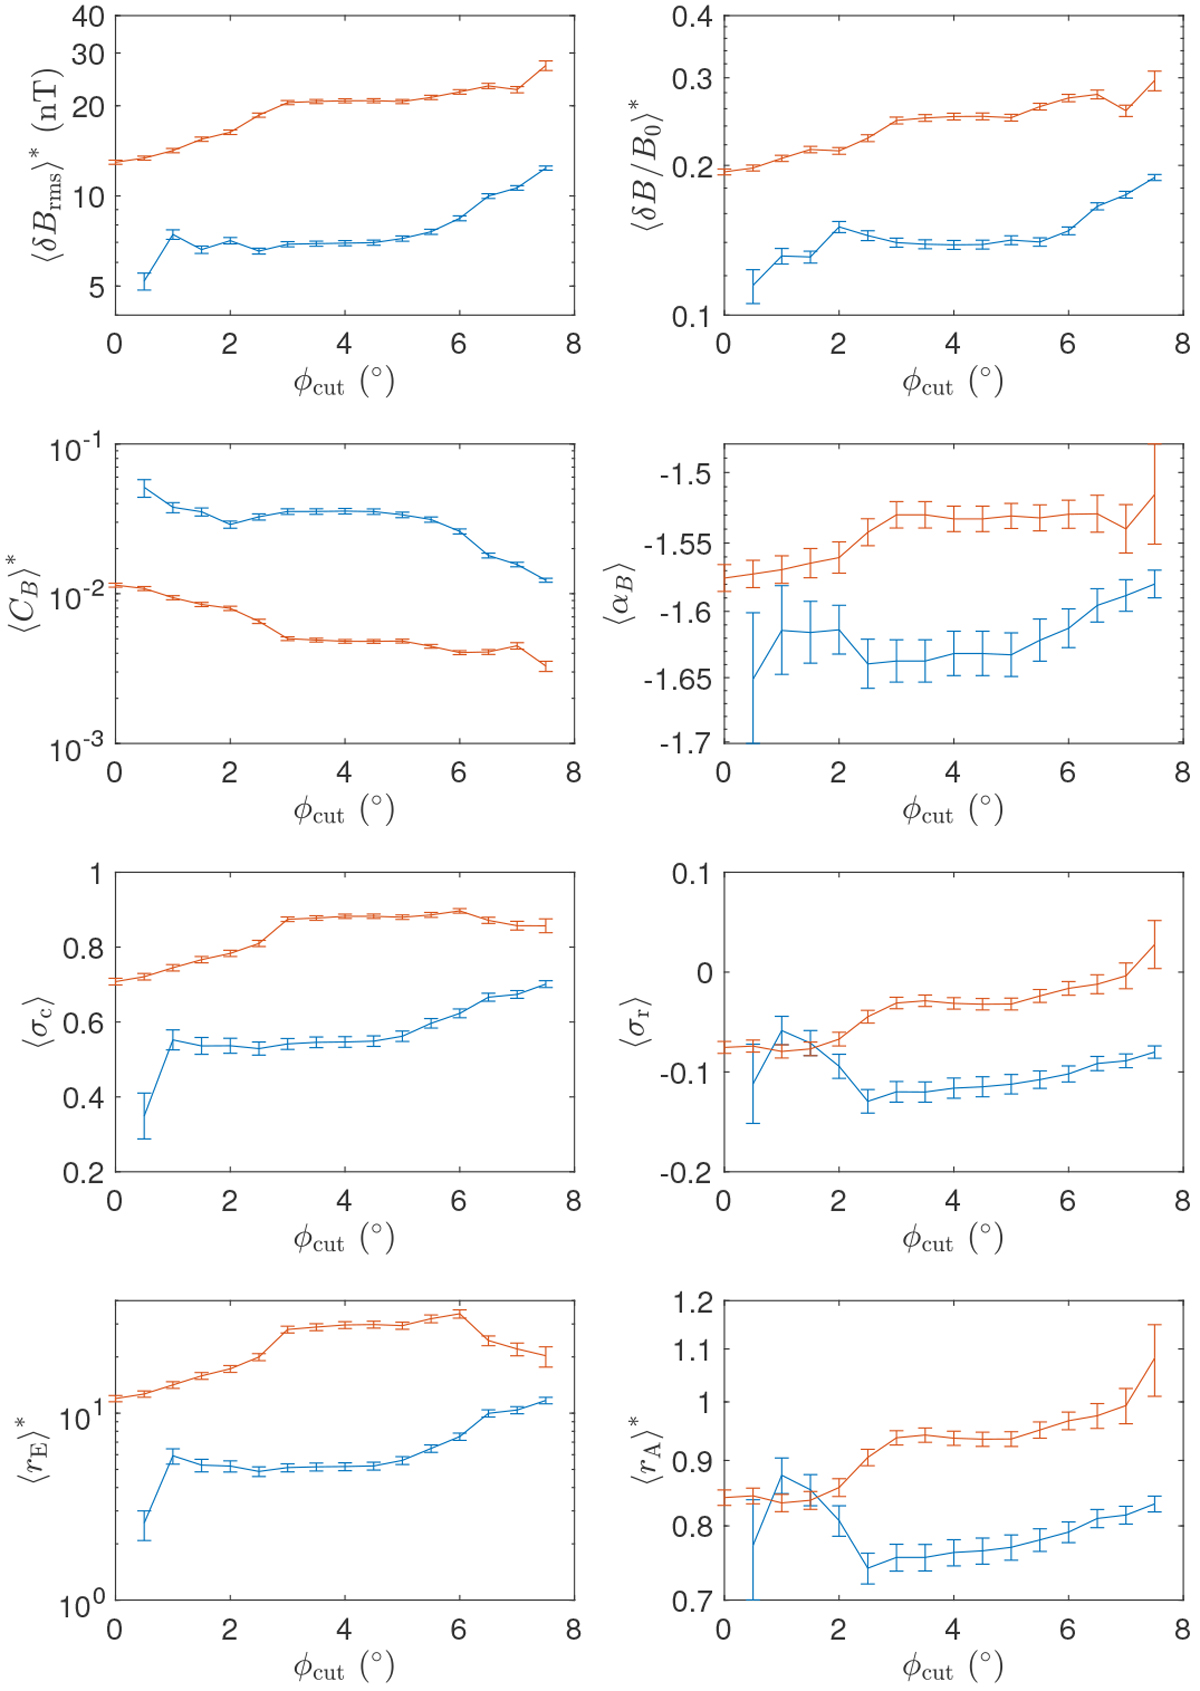
Average turbulence properties for times close to (blue) and far from (red) the HCS as a function of the value ϕcut used to define close and far. Averages are arithmetic means except for quantities marked with *, which are geometric means. The error bars represent the standard error of the mean. The largest overall difference in the average values is at ϕcut ≈ 4°.
Current usage metrics show cumulative count of Article Views (full-text article views including HTML views, PDF and ePub downloads, according to the available data) and Abstracts Views on Vision4Press platform.
Data correspond to usage on the plateform after 2015. The current usage metrics is available 48-96 hours after online publication and is updated daily on week days.
Initial download of the metrics may take a while.