Fig. 4
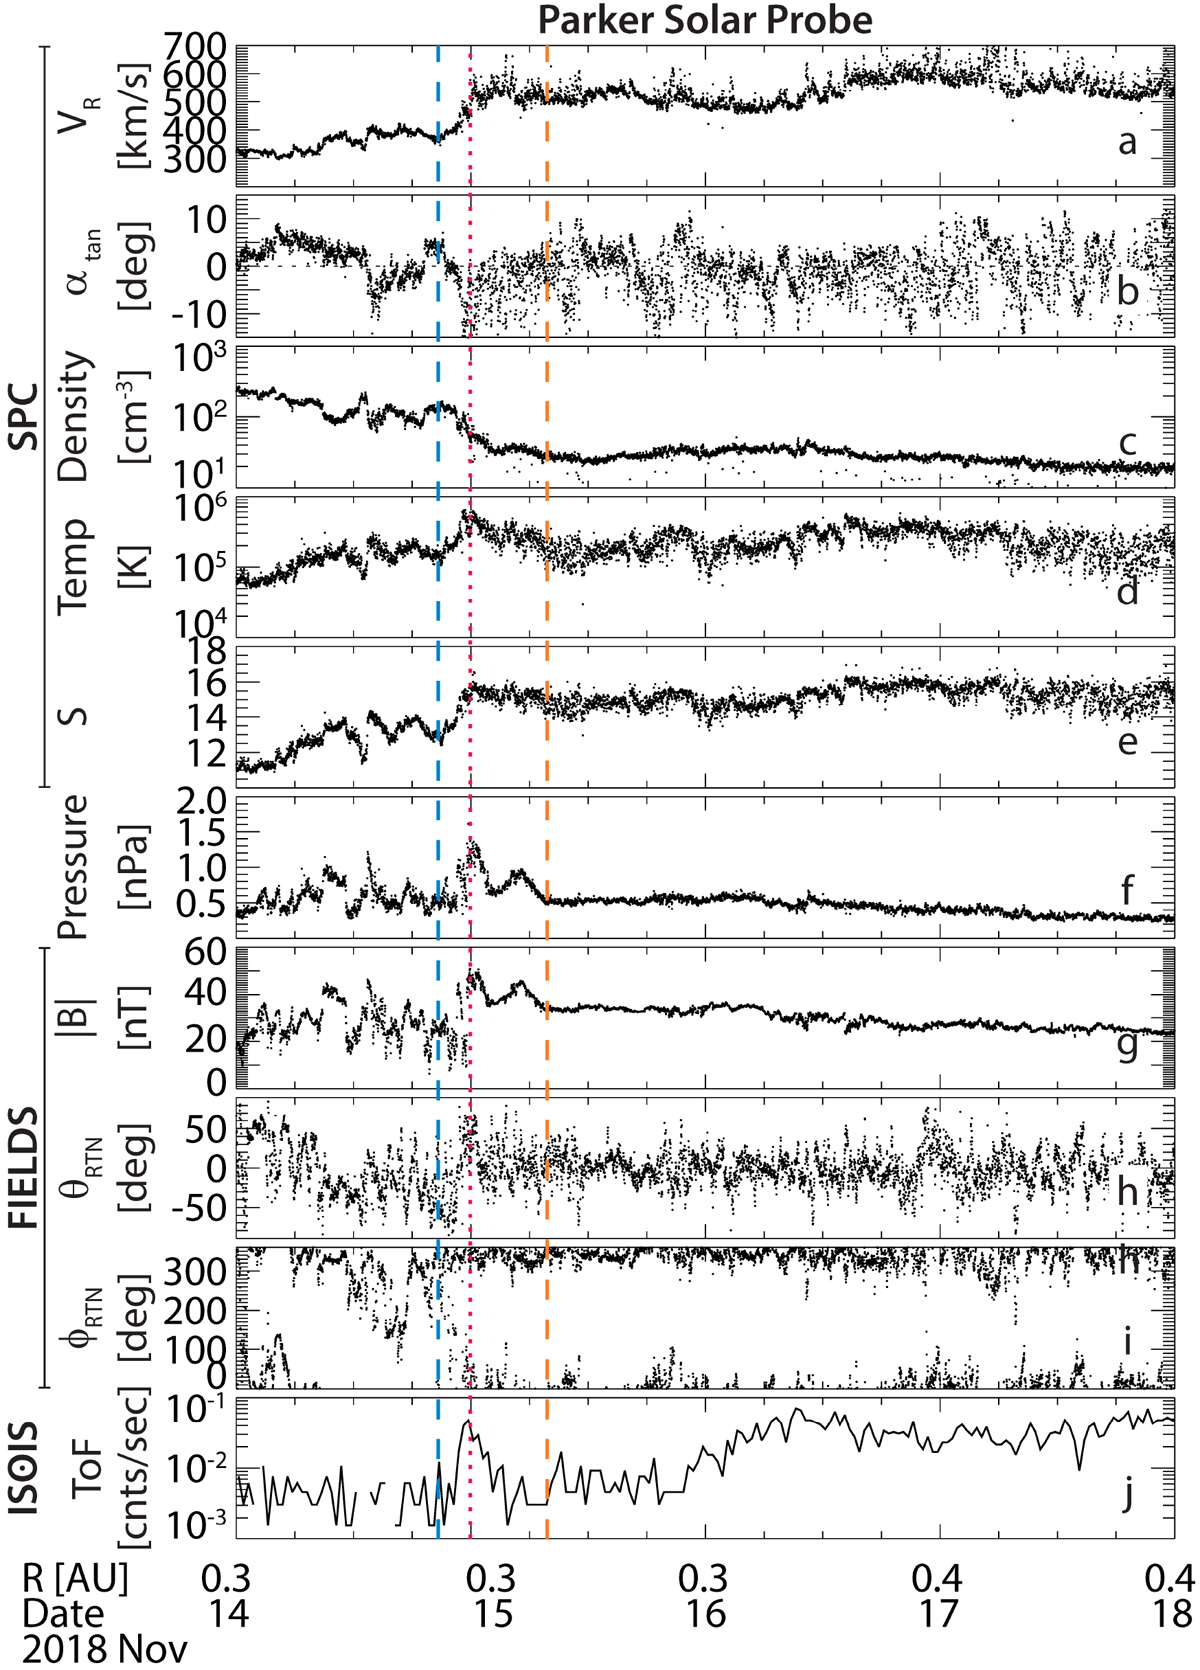
Example of a clean SIR and CIR event observed by PSP showing: (a) radial H+ velocity, (b) tangential H+ velocity deflection, (c) H+ density, (d) H+ temperature, (e) specific entropy argument, (f) sum of H+ plasma and magnetic pressure, (g) magnetic field magnitude, (h) magnetic ΘRTN, (i) magnetic ΦRTN, and (j) 30–586 keV suprathermal ion count rate. The blue and orange vertical dashed lines indicate where the radial velocity transitions from slow to fast solar wind. The red dotted line denotes the pressure peak within the velocity increase.
Current usage metrics show cumulative count of Article Views (full-text article views including HTML views, PDF and ePub downloads, according to the available data) and Abstracts Views on Vision4Press platform.
Data correspond to usage on the plateform after 2015. The current usage metrics is available 48-96 hours after online publication and is updated daily on week days.
Initial download of the metrics may take a while.