Fig. 9
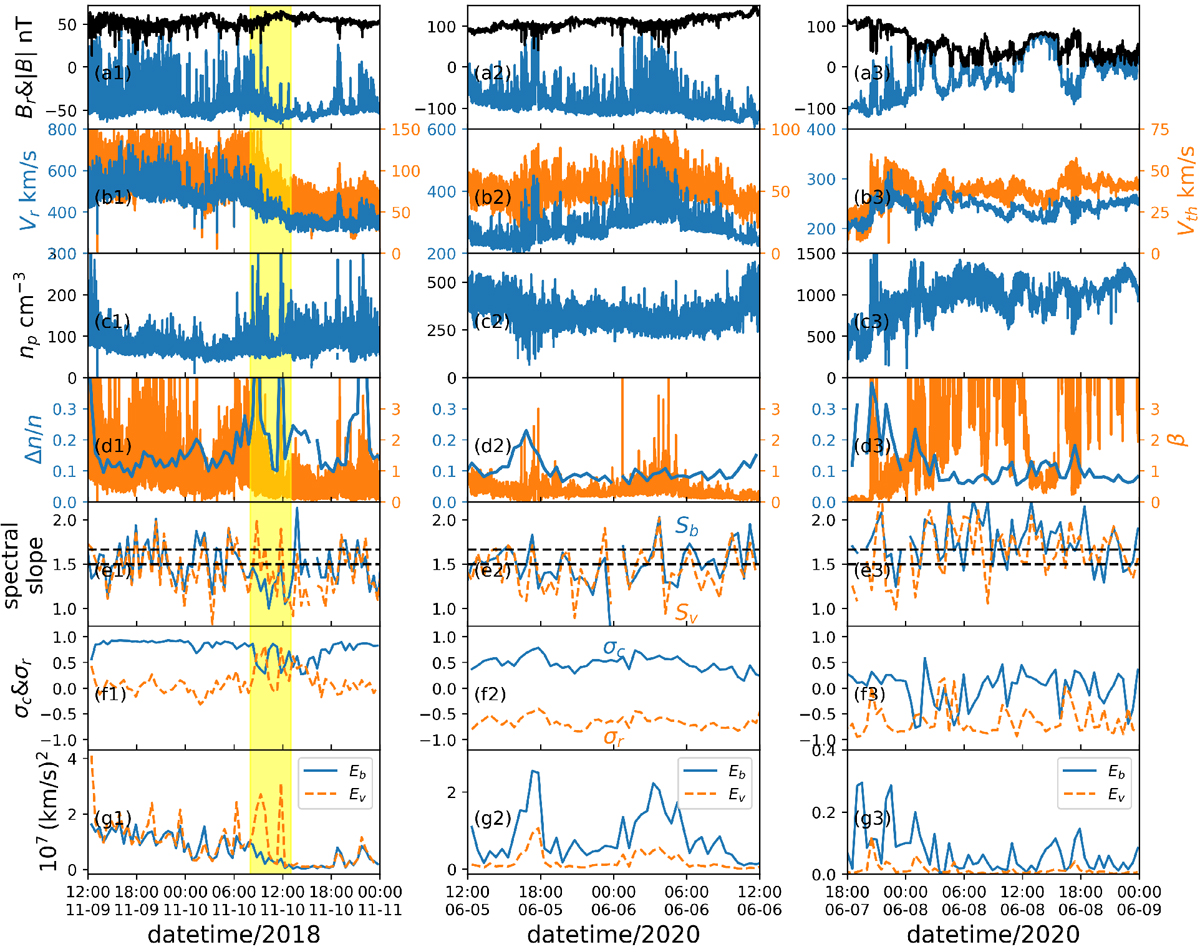
Blow-ups of the time periods marked by the shaded regions in Fig. 1. Row a: radial magnetic field Br (blue) and magnitude of magnetic field |B| (black). Rowb: radial flow speed Vr (blue) and ion thermal speed Vth (orange). Row c: ion density np. Row d: relative ion density fluctuation Δn∕n (blue) and plasma beta β (orange), defined as the ion thermal pressure ![]() divided by magnetic pressure pmag = B2∕2μ0. Row e: spectral slopes of magnetic field in Alfvén speed (blue) and velocity (orange). The two dashed lines mark 3∕2 and 5∕3 for reference. Row f: σc (blue) and σr (orange). Row g: energies in magnetic field fluctuations Eb (blue) and velocity fluctuations Ev (orange).
divided by magnetic pressure pmag = B2∕2μ0. Row e: spectral slopes of magnetic field in Alfvén speed (blue) and velocity (orange). The two dashed lines mark 3∕2 and 5∕3 for reference. Row f: σc (blue) and σr (orange). Row g: energies in magnetic field fluctuations Eb (blue) and velocity fluctuations Ev (orange).
Current usage metrics show cumulative count of Article Views (full-text article views including HTML views, PDF and ePub downloads, according to the available data) and Abstracts Views on Vision4Press platform.
Data correspond to usage on the plateform after 2015. The current usage metrics is available 48-96 hours after online publication and is updated daily on week days.
Initial download of the metrics may take a while.