Fig. 4
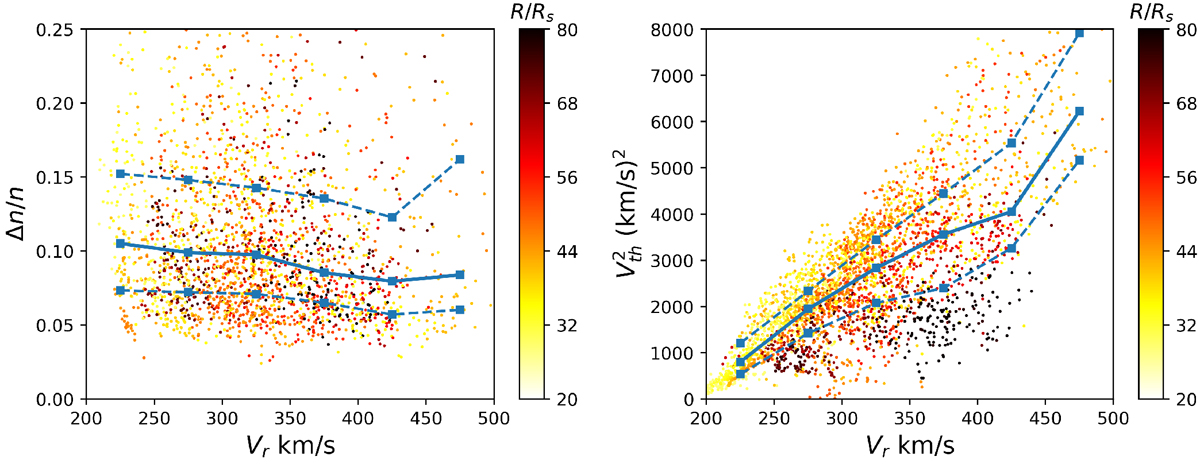
Relative density fluctuation Δn∕n (left) and ion temperature (right) expressed in thermal speed squared as functions of radial solar wind speed. Each dot corresponds to a single half-hour window and the colors represent the radial distance to the Sun. Squares on solid curves are median values of the dots binned according to Vr, and squares on dashed curves are the other two quartiles.
Current usage metrics show cumulative count of Article Views (full-text article views including HTML views, PDF and ePub downloads, according to the available data) and Abstracts Views on Vision4Press platform.
Data correspond to usage on the plateform after 2015. The current usage metrics is available 48-96 hours after online publication and is updated daily on week days.
Initial download of the metrics may take a while.