Fig. 11
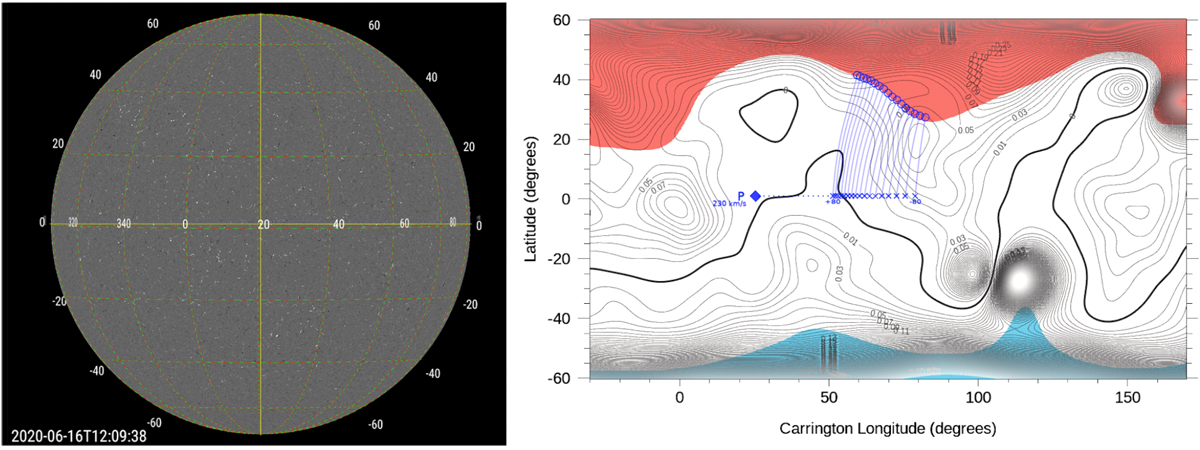
Left: SDO/HMI image taken on Jun 16, 2020, corresponding to Encounter 5 of PSP. The grid is in Carrington degrees. One can see that during Encounter 5, the visible side of the Sun was very quiet. Right: magnetic pressure map at R = 1.2Rs calculated by the PFSS model with the source surface at Rss = 2.5Rs and SDO/HMI data on Jun 16, 2020 as input. The blue diamond is the direct radial projection of PSP to the source surface. The blue crosses are the foot points of the magnetic field lines connected to PSP on the source surface. Different blue crosses correspond to a prediction using varying wind speeds, from 230 − 80 to 230 + 80 km s−1. The blue circles are on the surface R = 1.2Rs and are magnetically connected to the blue crosses. The thick black lines are the neutral lines at R = 1.2Rs, and colored regions are the open magnetic field regions with blue being negative polarity and red being positive polarity.
Current usage metrics show cumulative count of Article Views (full-text article views including HTML views, PDF and ePub downloads, according to the available data) and Abstracts Views on Vision4Press platform.
Data correspond to usage on the plateform after 2015. The current usage metrics is available 48-96 hours after online publication and is updated daily on week days.
Initial download of the metrics may take a while.