Fig. 1
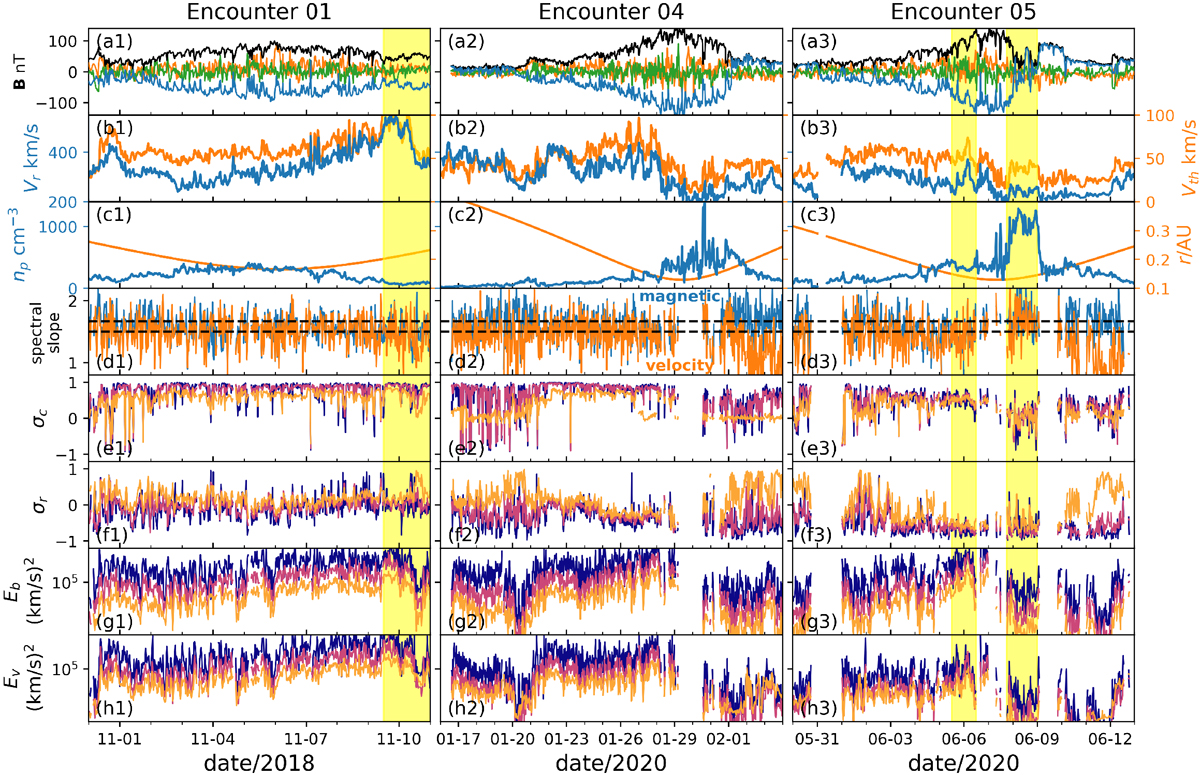
Overview of Encounter 01, 04, and 05. Row a: magnetic field with blue, orange, and green curves being radial, tangential, and normal components (RTN coordinates) and the black curve being the magnitude. Row b: radial ion flow speed (blue) and ion thermal speed (orange). Row c: ion density (blue) and radial distance of PSP to the Sun (orange). Row d: spectral slopes of the magnetic field in Alfvén speed (blue) and velocity (orange). The two dashed lines mark the values 3∕2 and 5∕3 for reference. Rows e–h: σc, σr, Eb, and Ev, respectively, as defined in Sect. 2. In each panel of these four rows, three curves are plotted and they correspond to wave band 2 (blue), 5 (purple), and 8 (yellow), respectively. All quantities were averaged or calculated through Fourier analysis in the 2048 × 0.874 ≈ 30 min time window as described in Sect. 2.
Current usage metrics show cumulative count of Article Views (full-text article views including HTML views, PDF and ePub downloads, according to the available data) and Abstracts Views on Vision4Press platform.
Data correspond to usage on the plateform after 2015. The current usage metrics is available 48-96 hours after online publication and is updated daily on week days.
Initial download of the metrics may take a while.