Fig. 12
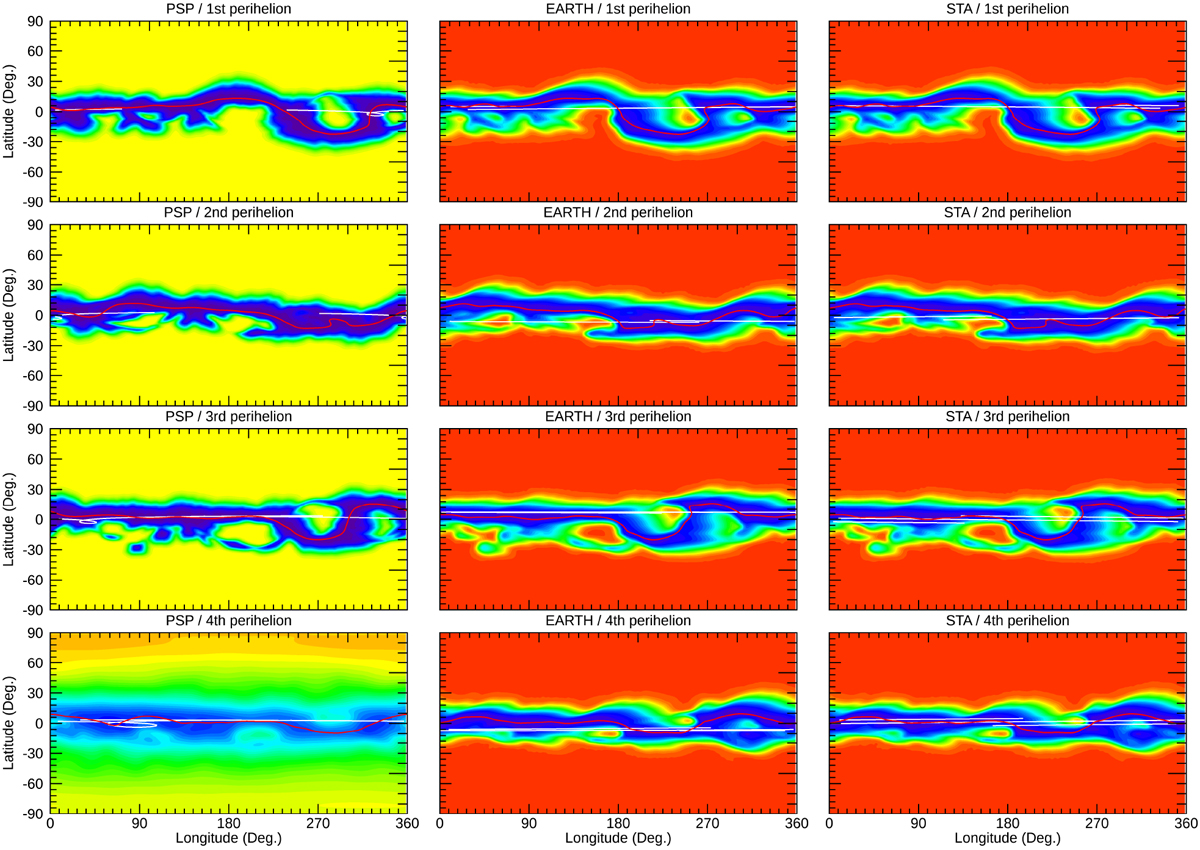
Comparison of MHD modeled solar wind speeds at the location of the three spacecraft (PSP, Earth, and Stereo-A (STA)) with the interval defined by each PSP perihelia pass (1-4). In each panel, speeds from 200 to 800 km s−1 are shown in the rainbow spectrum from blue to red, using the same transitions as in Fig. 2’s colour bar. The orbit of each spacecraft is shown by the white curve and the location of the HCS is marked by the red contour (Br = 0).
Current usage metrics show cumulative count of Article Views (full-text article views including HTML views, PDF and ePub downloads, according to the available data) and Abstracts Views on Vision4Press platform.
Data correspond to usage on the plateform after 2015. The current usage metrics is available 48-96 hours after online publication and is updated daily on week days.
Initial download of the metrics may take a while.