Fig. 1

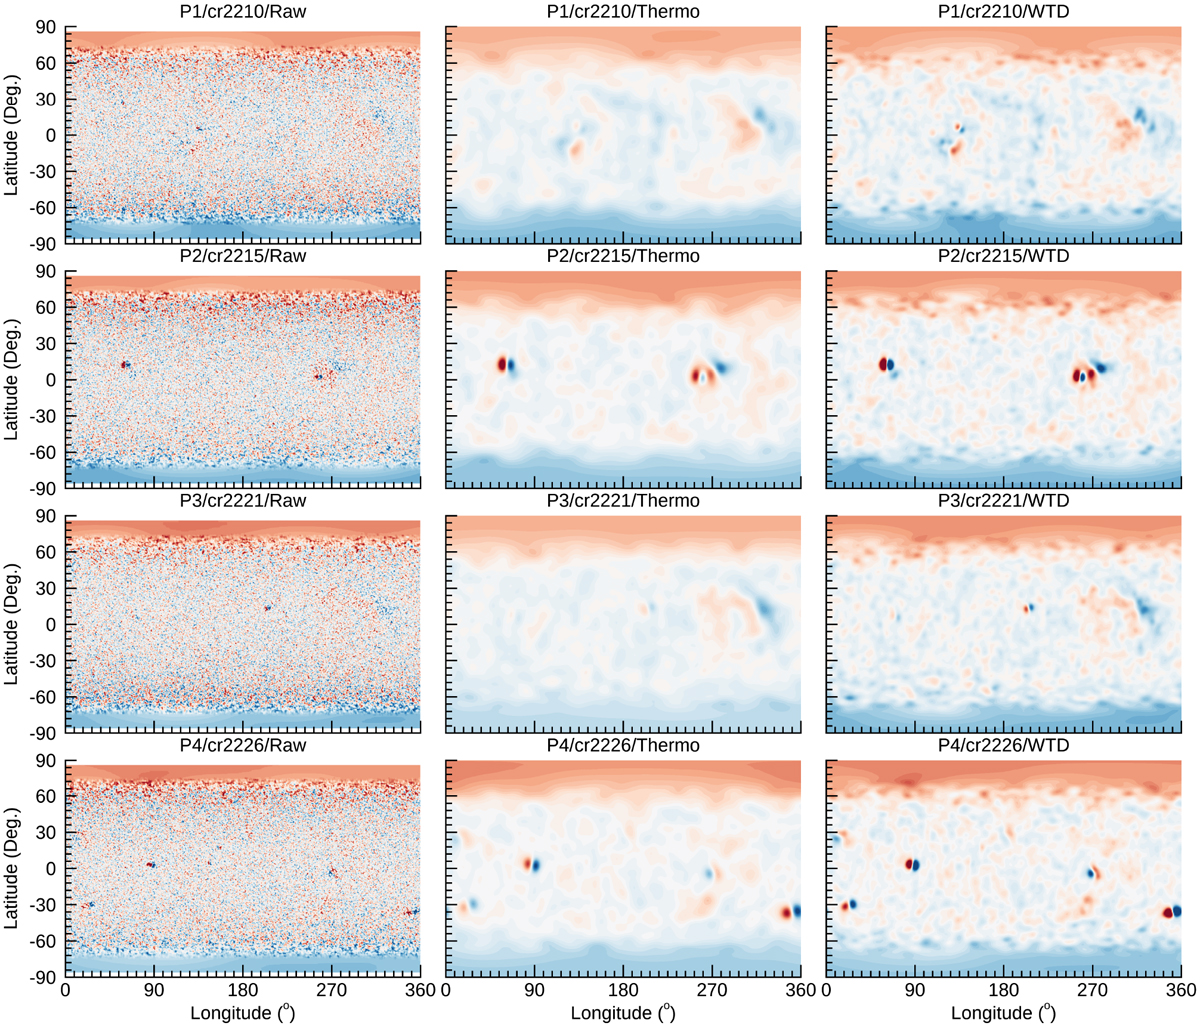
Comparison of HMI magnetograms for each for the four Perihelia intervals (P1, P2, P3, and P4), which occurred during CR 2210, 2215, 2221, and 2226. Left column: original HMI synoptic maps, with the polar regions filled in. Middle column: processed magnetograms used to drive the polytropic and thermodynamic models, and right column: synoptic maps used to drive the WTD model. Blue/red corresponds to negative/positive polarities, respectively, and the maps have been saturated at ± 10 G; thus, some of the ARs such as during CR2215, contain field strengths larger than this maximum.
Current usage metrics show cumulative count of Article Views (full-text article views including HTML views, PDF and ePub downloads, according to the available data) and Abstracts Views on Vision4Press platform.
Data correspond to usage on the plateform after 2015. The current usage metrics is available 48-96 hours after online publication and is updated daily on week days.
Initial download of the metrics may take a while.


