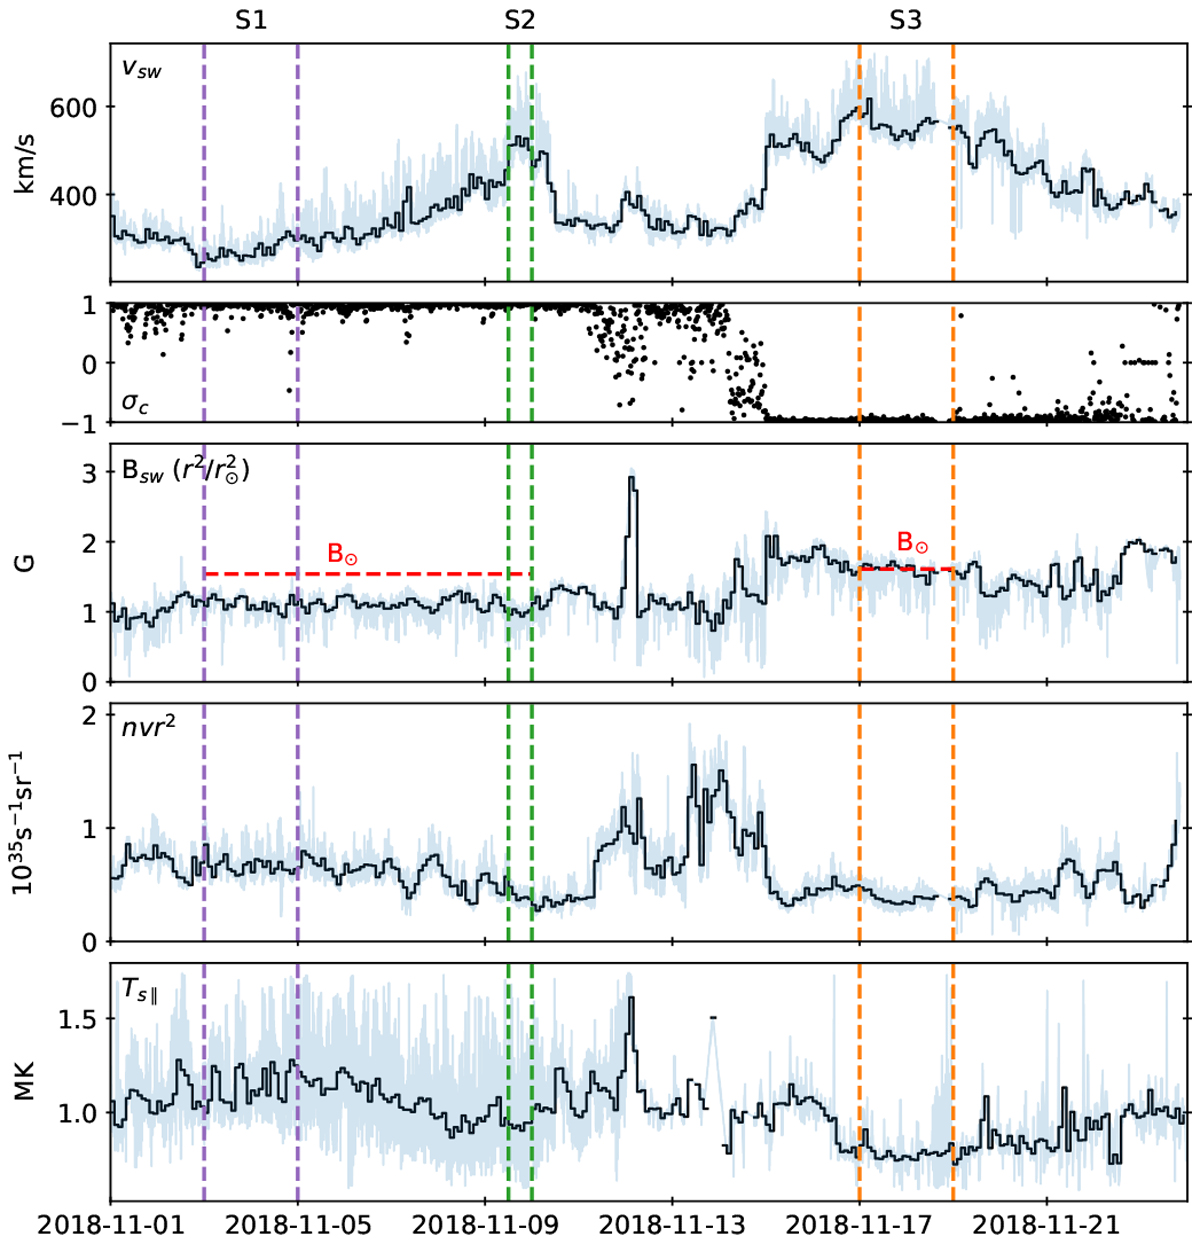
Fig. 2

PSP measurements during perihelion 1, with vertical dashed lines bounding the three distinct streams discussed in the text. Light grey lines are one-minute measurements and the solid black lines are two-hour averages. Top panel: solar wind velocity, and second panel: cross helicity calculated on a 20-min scale. Third panel: in situ magnetic field, scaled by
![]() to make it directly comparable to coronal magnetic field strengths. Horizontal dashed lines show the corresponding magnetic field strength in the source coronal holes. Fourth panel: solar wind mass flux, and fifth panel: parallel electron strahl temperature.
to make it directly comparable to coronal magnetic field strengths. Horizontal dashed lines show the corresponding magnetic field strength in the source coronal holes. Fourth panel: solar wind mass flux, and fifth panel: parallel electron strahl temperature.
Current usage metrics show cumulative count of Article Views (full-text article views including HTML views, PDF and ePub downloads, according to the available data) and Abstracts Views on Vision4Press platform.
Data correspond to usage on the plateform after 2015. The current usage metrics is available 48-96 hours after online publication and is updated daily on week days.
Initial download of the metrics may take a while.


