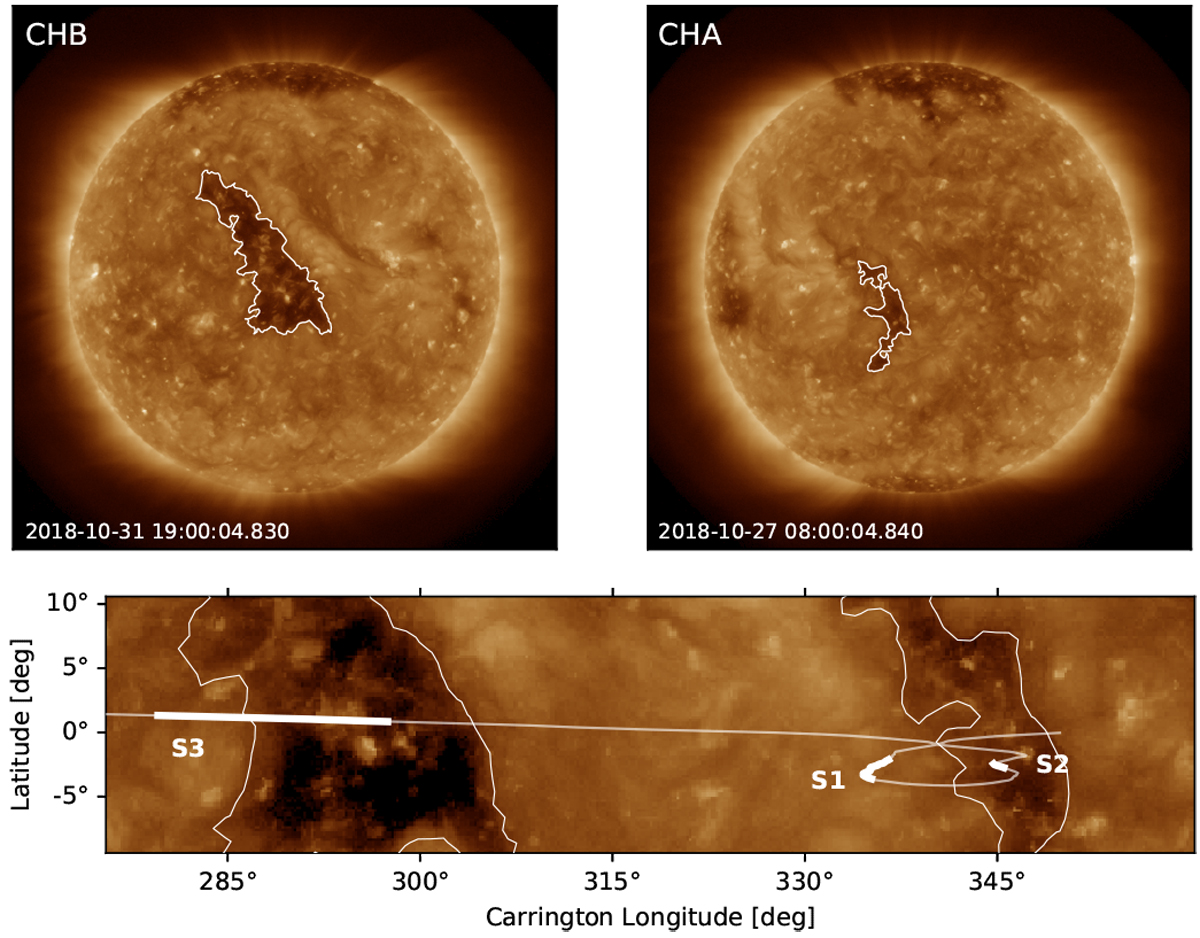
Fig. 1

Overview of coronal holes along the orbit of PSP during perihelion 1. Top panel: two coronal holes sampled by PSP, with contours showing the identified coronal hole with an intensity threshold at 50 DN s−1. The y-axis is aligned with solar north in both images, and the colour scale is clipped at 3000 DN s−1. Bottom panel: Carrington map of the same two coronal holes, with the white line showing the trajectory of PSP ballistically backmappedto 2.5r⊙. Labelled areas of the trajectory are the in situ data intervals selected for analysis.
Current usage metrics show cumulative count of Article Views (full-text article views including HTML views, PDF and ePub downloads, according to the available data) and Abstracts Views on Vision4Press platform.
Data correspond to usage on the plateform after 2015. The current usage metrics is available 48-96 hours after online publication and is updated daily on week days.
Initial download of the metrics may take a while.


