Fig. A.1
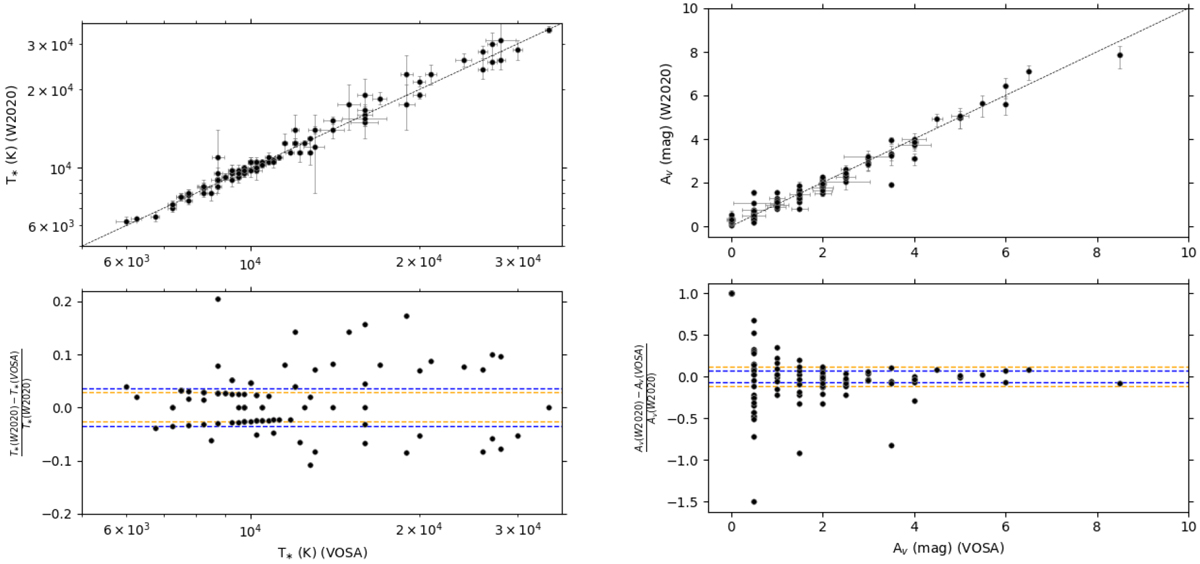
Top: comparison between T* and Av estimated from VOSA and from W2020. The dashed black line indicates equal values. Bottom: relative errors resulting from the comparison of the corresponding values from VOSA and W2020. The orange line indicates the typical median relative (±) error of this comparison. The median relative (±) error provided in W2020 is also plotted with the blue lines for reference.
Current usage metrics show cumulative count of Article Views (full-text article views including HTML views, PDF and ePub downloads, according to the available data) and Abstracts Views on Vision4Press platform.
Data correspond to usage on the plateform after 2015. The current usage metrics is available 48-96 hours after online publication and is updated daily on week days.
Initial download of the metrics may take a while.