Free Access
Fig. 8
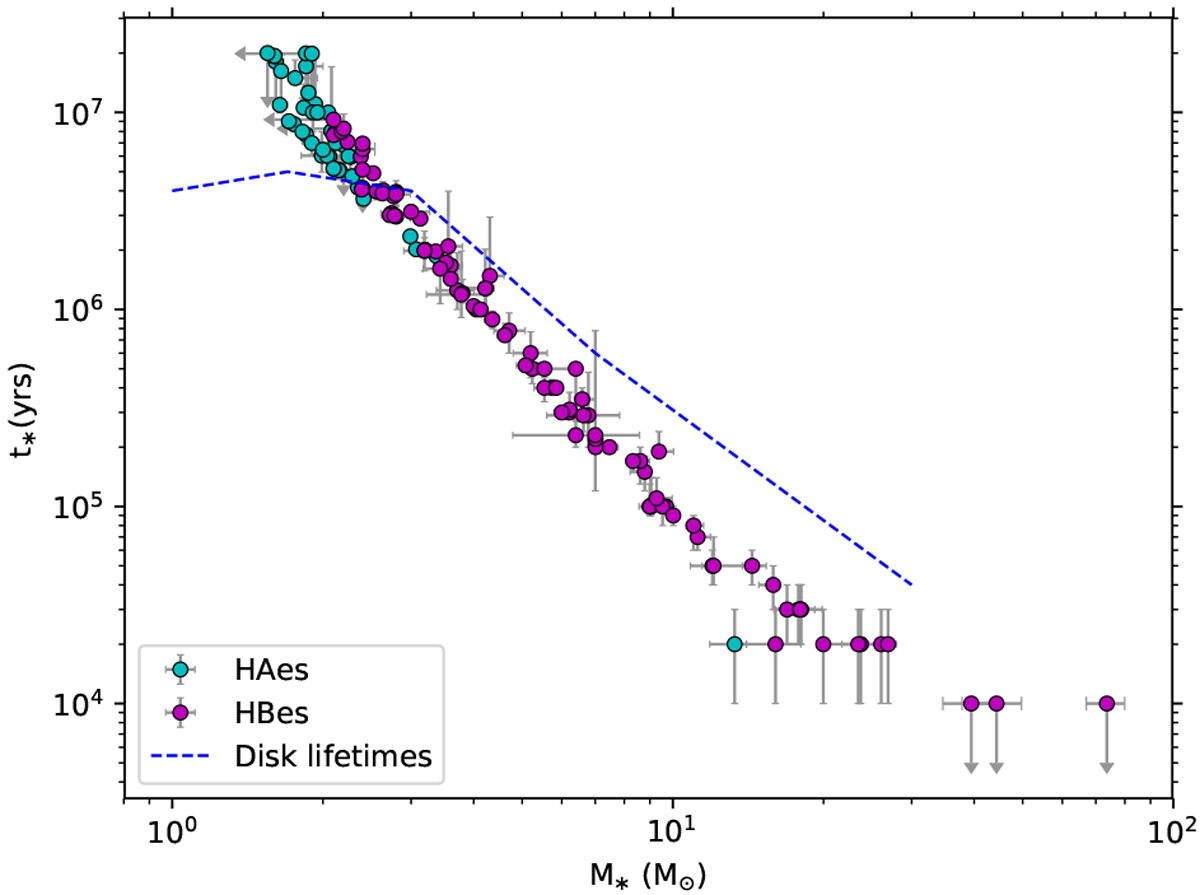
Stellar age vs. stellar mass for HAes and HBes. The dashed blue line represents the disk lifetime below which the stars are consistent with the photoevaporation scenario (see text). Upper limits are indicated by arrows.
Current usage metrics show cumulative count of Article Views (full-text article views including HTML views, PDF and ePub downloads, according to the available data) and Abstracts Views on Vision4Press platform.
Data correspond to usage on the plateform after 2015. The current usage metrics is available 48-96 hours after online publication and is updated daily on week days.
Initial download of the metrics may take a while.