Free Access
Fig. 4
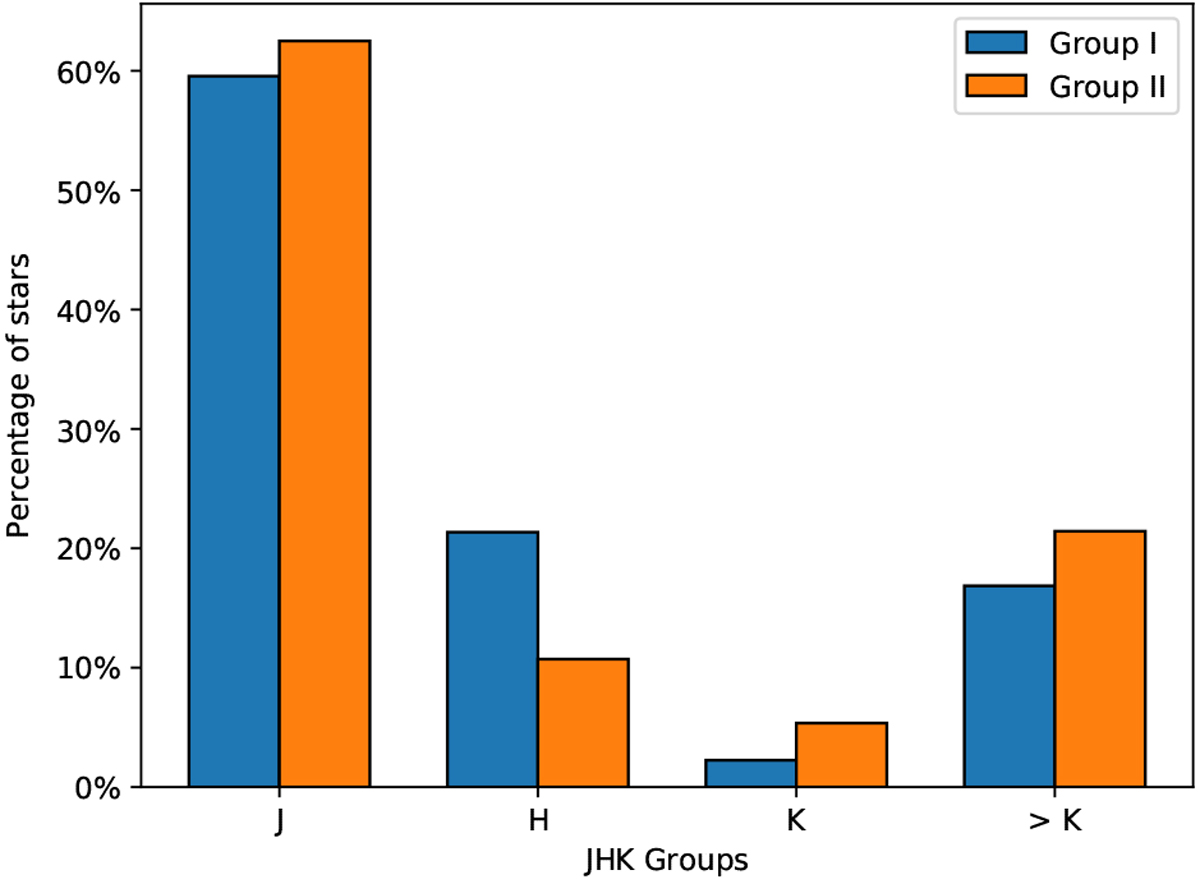
Histogram comparing the distributions of the JHK groups (based on the wavelength at which the infrared excess starts) and M01 groups (based on the shape of the SEDs), as indicated in the x-axis and the legend.
Current usage metrics show cumulative count of Article Views (full-text article views including HTML views, PDF and ePub downloads, according to the available data) and Abstracts Views on Vision4Press platform.
Data correspond to usage on the plateform after 2015. The current usage metrics is available 48-96 hours after online publication and is updated daily on week days.
Initial download of the metrics may take a while.