Fig. A.2
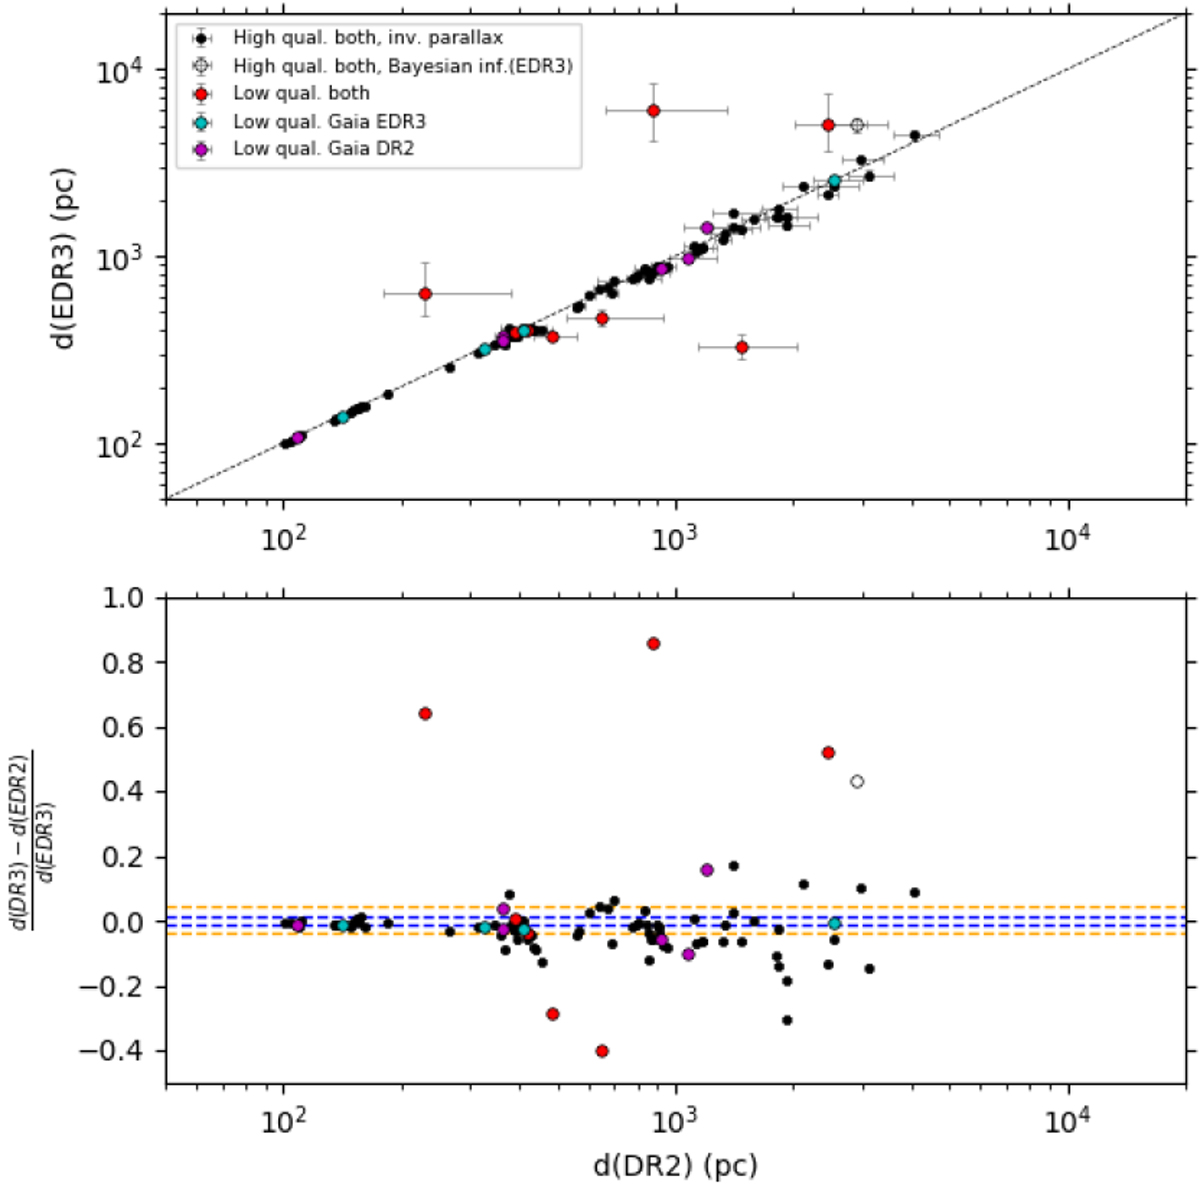
Top: comparison of Gaia DR2 and Gaia EDR3 distances. Black, red, cyan, and purple circles correspond to objects that have high-quality parallaxes in both releases, low quality in both releases, low quality in Gaia EDR3, and low quality in Gaia DR2, respectively. In addition, objects with high quality in both releases whose EDR3 distances have been estimated using the inverse of parallax (filled black circles) or Bayesian inference (open black circles) are indicated (note that all DR2 distances were estimated using Bayesian inference; Vioque et al. 2018). Bottom: relative errors resulting from the comparison of Gaia DR2 and Gaia EDR3 distances. The orange line indicates the typical median relative (±) error of such a comparison. The median relative (±) error in Gaia EDR3 distances is also plotted with the blue lines for reference. The relative error of VY Mon is < − 1 and is not plotted for clarity.
Current usage metrics show cumulative count of Article Views (full-text article views including HTML views, PDF and ePub downloads, according to the available data) and Abstracts Views on Vision4Press platform.
Data correspond to usage on the plateform after 2015. The current usage metrics is available 48-96 hours after online publication and is updated daily on week days.
Initial download of the metrics may take a while.