Fig. 8
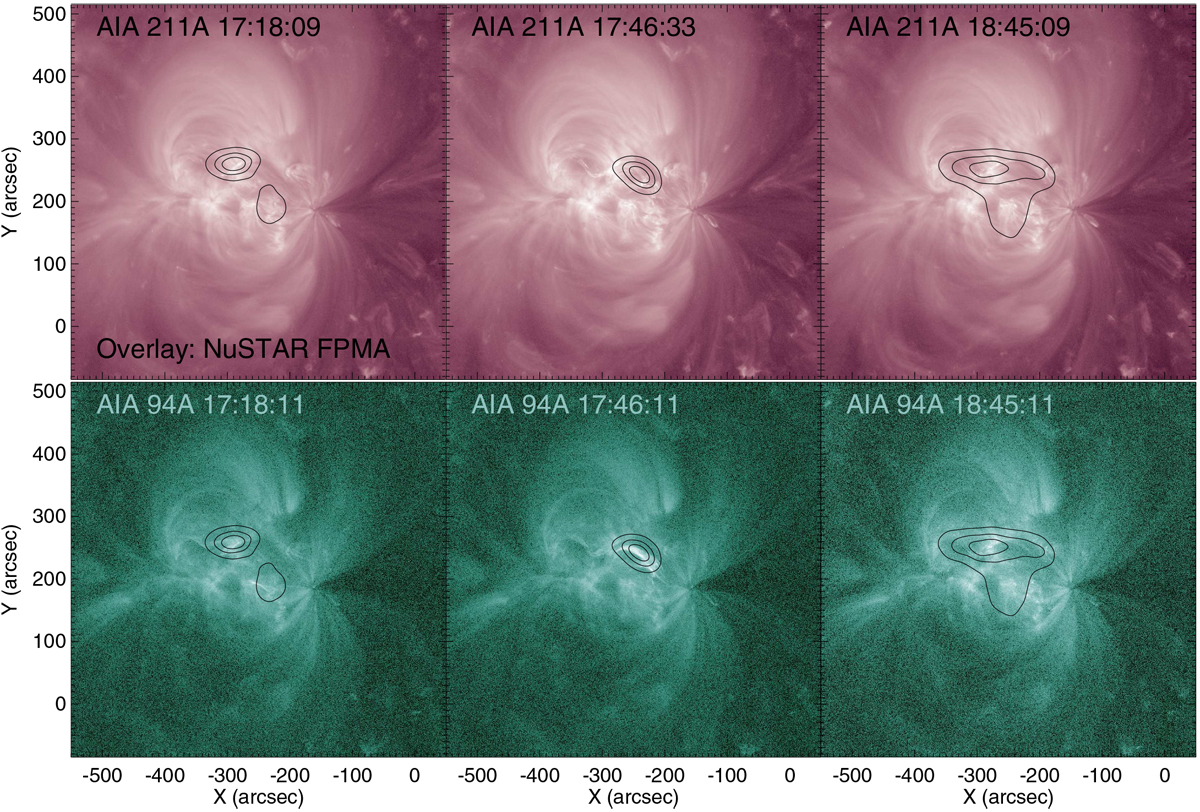
NuSTAR emission from 2 to 6 keV overlaid on AIA images in the (top) 211 Å and (bottom) 94 Å bandpass filters. The times of integration for the NuSTAR images are 17:15 to 17:21 UT, 17:44 to 17:49 UT, and 18:40 to 1850 UT in the left, center, and right columns respectively. NuSTAR images were deconvolved for ten iterations. As discussed in the text, there is uncertainty in the coalignment of NuSTAR and AIA emission.
Current usage metrics show cumulative count of Article Views (full-text article views including HTML views, PDF and ePub downloads, according to the available data) and Abstracts Views on Vision4Press platform.
Data correspond to usage on the plateform after 2015. The current usage metrics is available 48-96 hours after online publication and is updated daily on week days.
Initial download of the metrics may take a while.