Fig. 4
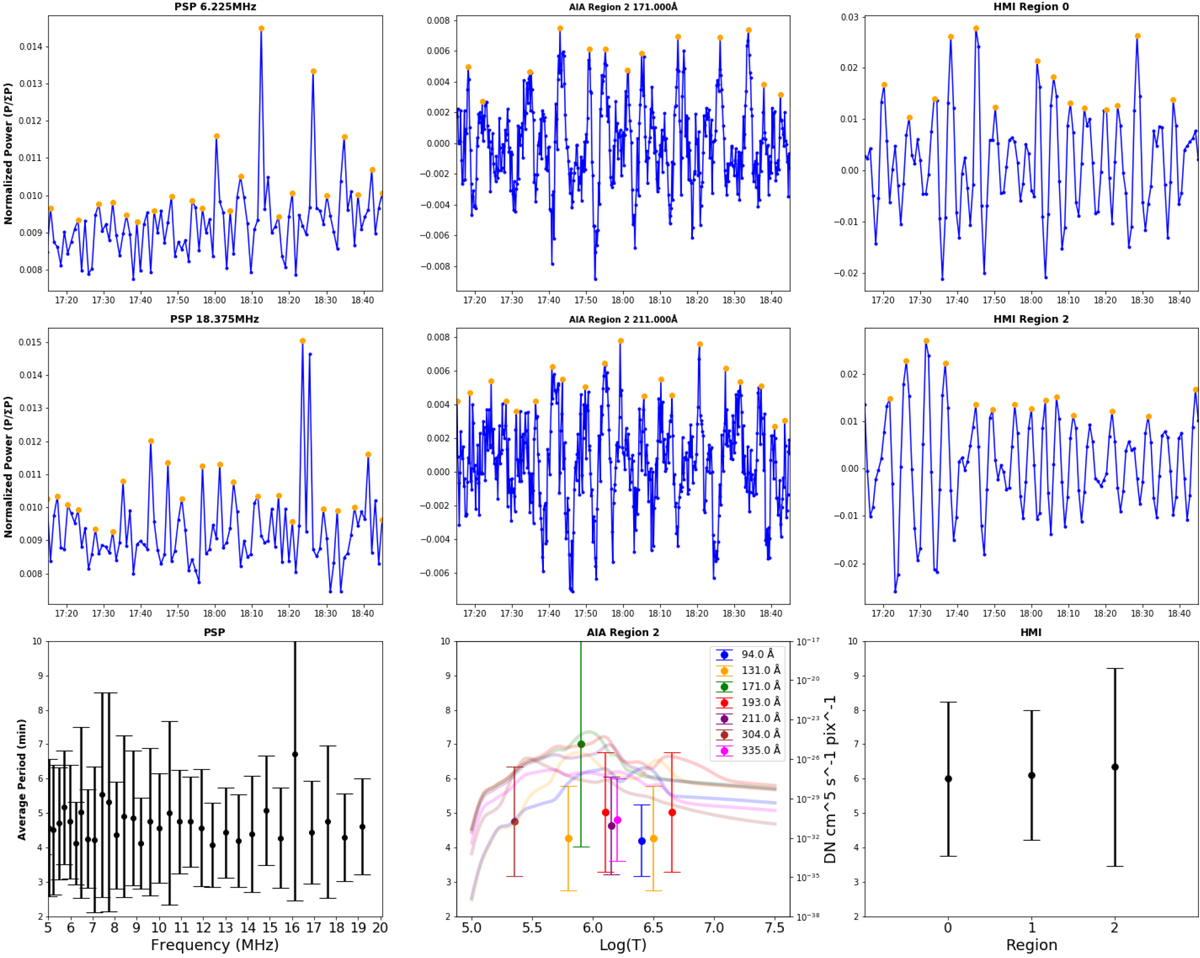
Periodicities in PSP/FIELDS HFR radio power, AIA emission in Region 2 (as defined in Fig. 3), and HMI intensity. (a) 6.225 MHz and (b) 18.375 MHz interpolated normalized power with black dots indicating the identified peaks; (c) periods identified for all frequencies >5 MHz; (d) AIA 171 Å and (e) 211 Å detrended normalized intensity with black dots indicating the identified peaks; and (f) periods identified for all AIA passbands in Region 2, versus wavelength with temperature response curves overplotted; (g) and (h) HMI emission in two regions; and (i) periods identified in HMI data. Panels d and e: AIA lightcurves have been detrended. The units are residual data numbers (DNs) after a 10-minute average curve was subtracted. Panel f: temperatures of the data points are those listed in Table 1 of Lemen et al. (2012) for each passband (these are approximately the peaks of the temperature responses), but the colored lines show the temperature responses themselves, in arbitrary units, to give a better representation of possible temperatures for each data point. When more than one temperature is listed in Table 1 of Lemen et al. (2012), we have included a data point for both, since we cannot distinguish them.
Current usage metrics show cumulative count of Article Views (full-text article views including HTML views, PDF and ePub downloads, according to the available data) and Abstracts Views on Vision4Press platform.
Data correspond to usage on the plateform after 2015. The current usage metrics is available 48-96 hours after online publication and is updated daily on week days.
Initial download of the metrics may take a while.