Fig. 3
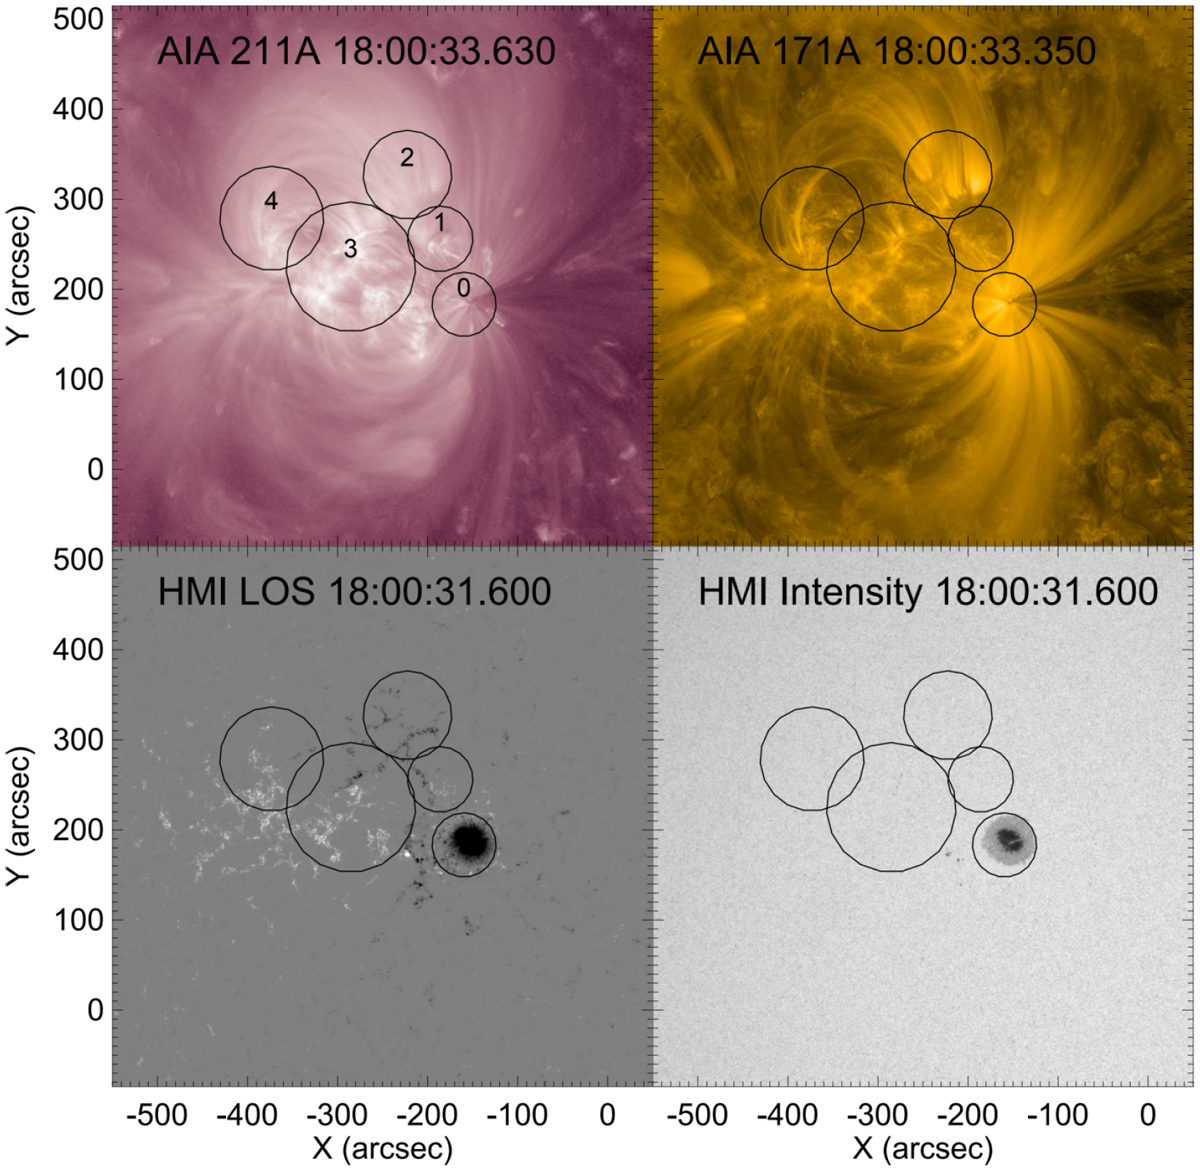
Regions analyzed overlaid on SDO images. Top row: two AIA filters that have sensitivity to quiescent coronal temperatures, and bottom row: HMI line-of-sight magnetogram and intensity map. Images shown are at a time near the middle of the analyzed interval. At the latitude of this active region, solar rotation causes sources to drift westward at a rate of about 10 arcsec per hour.
Current usage metrics show cumulative count of Article Views (full-text article views including HTML views, PDF and ePub downloads, according to the available data) and Abstracts Views on Vision4Press platform.
Data correspond to usage on the plateform after 2015. The current usage metrics is available 48-96 hours after online publication and is updated daily on week days.
Initial download of the metrics may take a while.