Free Access
Fig. A.2.
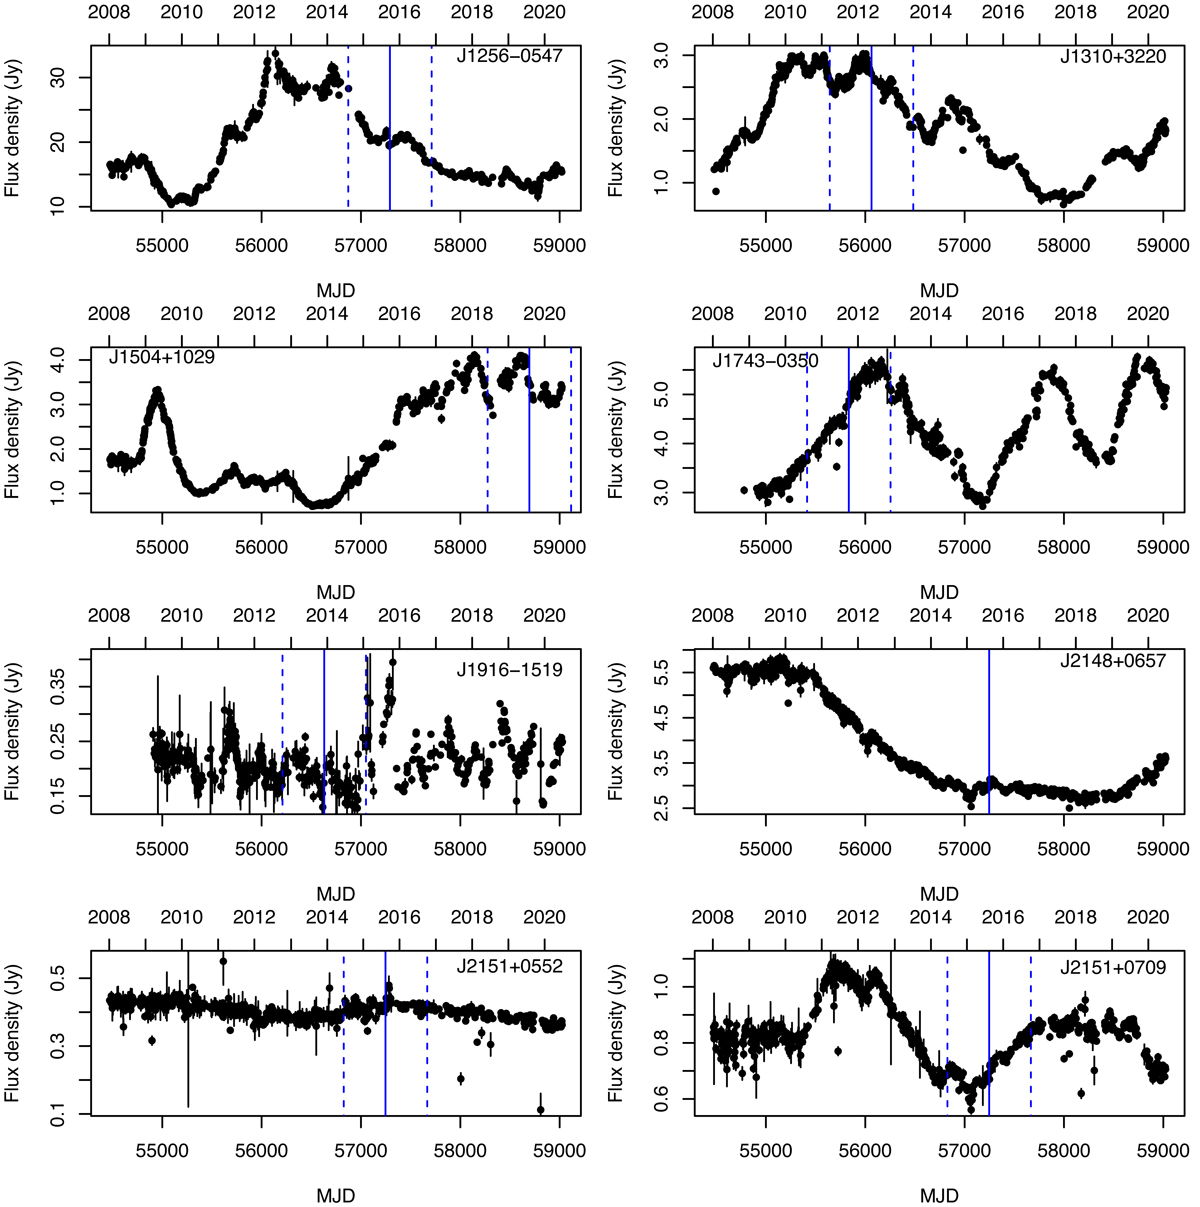
OVRO light curves of the associated sources. The neutrino arrival time is shown with a blue solid line, while the blue dashed lines indicate the window of 2.3 yr around the neutrino event for the sources included in the activity index analysis.
Current usage metrics show cumulative count of Article Views (full-text article views including HTML views, PDF and ePub downloads, according to the available data) and Abstracts Views on Vision4Press platform.
Data correspond to usage on the plateform after 2015. The current usage metrics is available 48-96 hours after online publication and is updated daily on week days.
Initial download of the metrics may take a while.