Fig. 2.
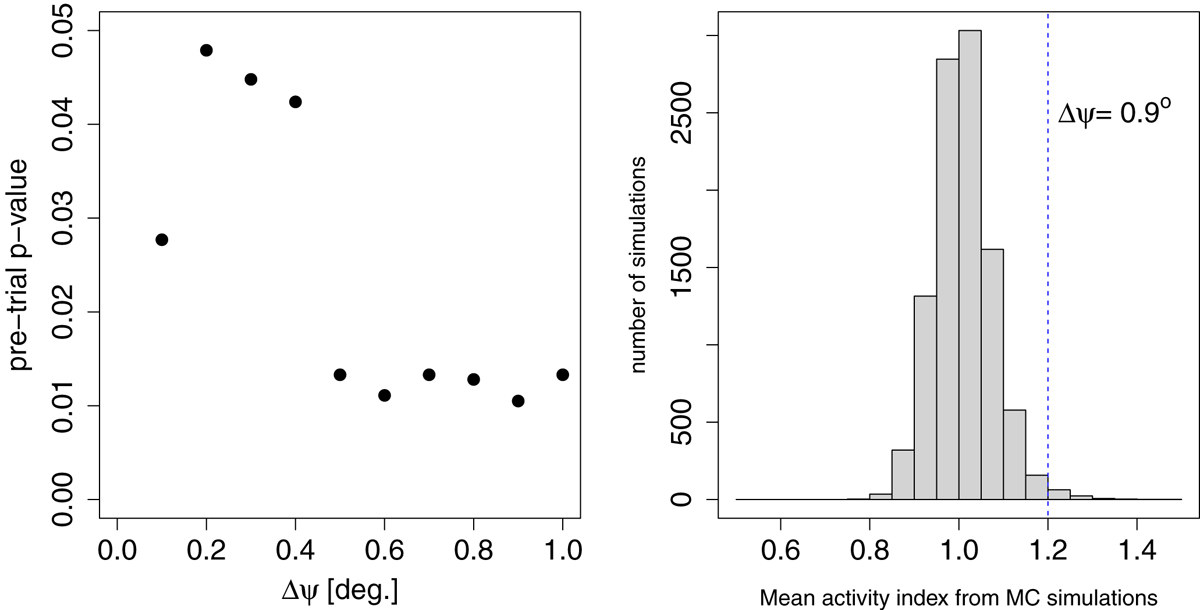
Example of the Monte Carlo process for estimating the pre-trial p-values. Left: pre-trial p-value for different Δψ values in the CGRaBS sample mean activity index analysis (Sect. 3.3.1). The minimum pre-trial p-value of 0.010 is obtained for Δψ = 0.9°. Right: distribution of the mean activity indices from the random samples for Δψ = 0.9°. The dashed blue line indicates the mean activity index of the associations in the real CGRaBS sample.
Current usage metrics show cumulative count of Article Views (full-text article views including HTML views, PDF and ePub downloads, according to the available data) and Abstracts Views on Vision4Press platform.
Data correspond to usage on the plateform after 2015. The current usage metrics is available 48-96 hours after online publication and is updated daily on week days.
Initial download of the metrics may take a while.