Fig. 1.
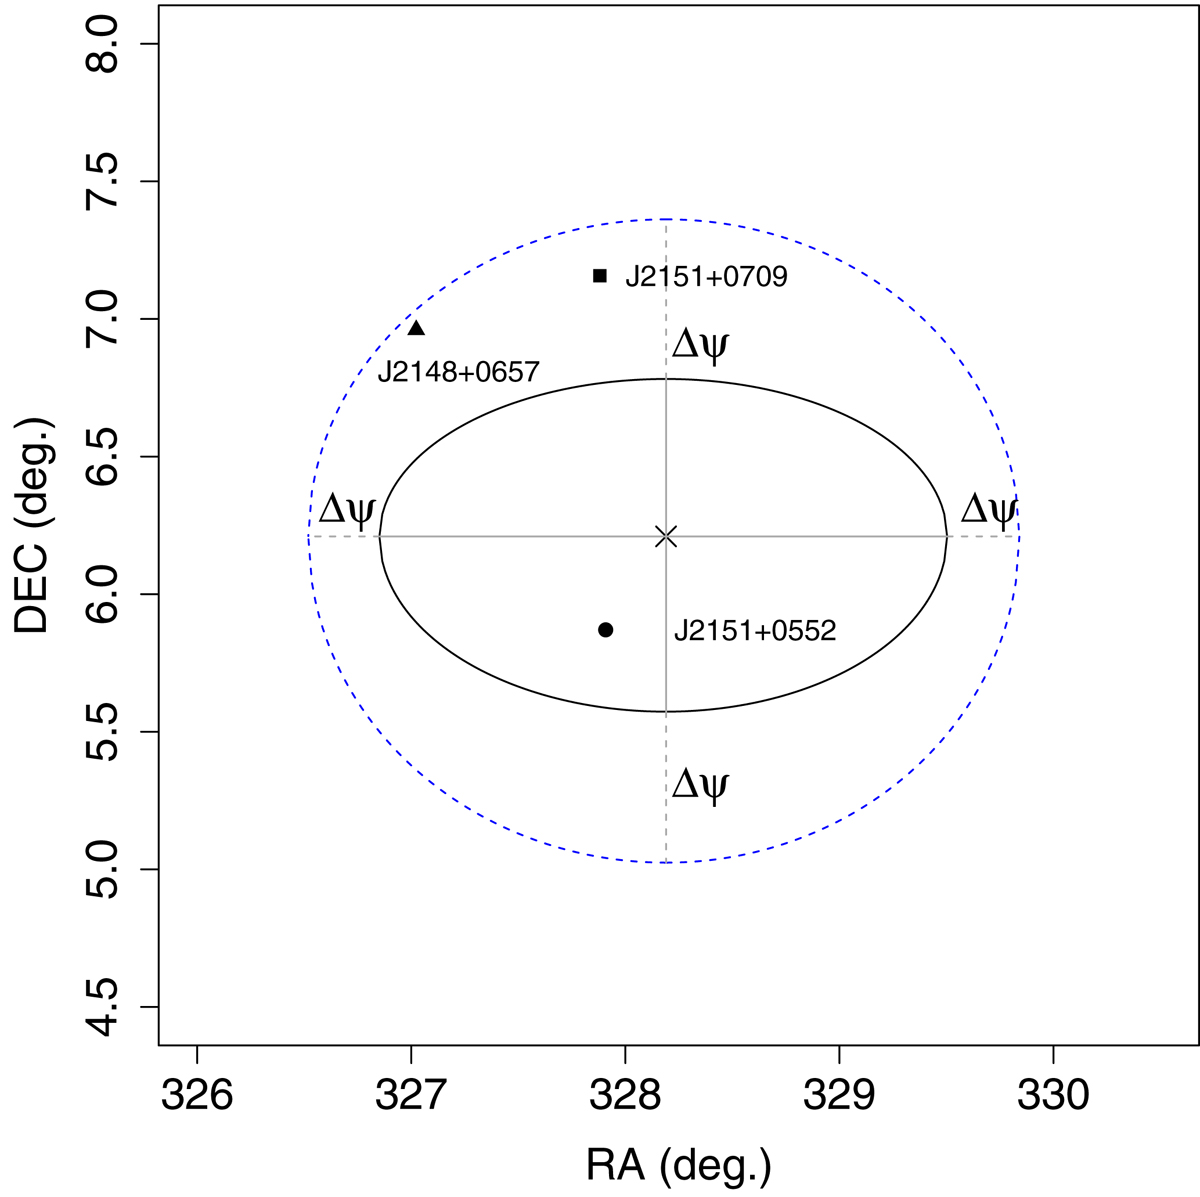
Example of the elliptical uncertainty region around the neutrino event on August 12, 2015 (MJD 57246; shown with a black cross), and the positions of the three associations found for it in the OVRO sample. The gray solid lines mark the asymmetric statistical uncertainties in each direction (given in Table 1), multiplied by the factor of 1.3 discussed in the text. The solid black line shows the two-dimensional error ellipse when only statistical uncertainties are included. The gray dashed lines show the additional systematic uncertainty Δψ = 1.0° as found optimal for the mean flux density analysis in the CGRaBS sample, which is added in quadrature to the statistical uncertainties in all directions, and the blue dashed line marks the resulting two-dimensional error ellipse.
Current usage metrics show cumulative count of Article Views (full-text article views including HTML views, PDF and ePub downloads, according to the available data) and Abstracts Views on Vision4Press platform.
Data correspond to usage on the plateform after 2015. The current usage metrics is available 48-96 hours after online publication and is updated daily on week days.
Initial download of the metrics may take a while.