Fig. 8
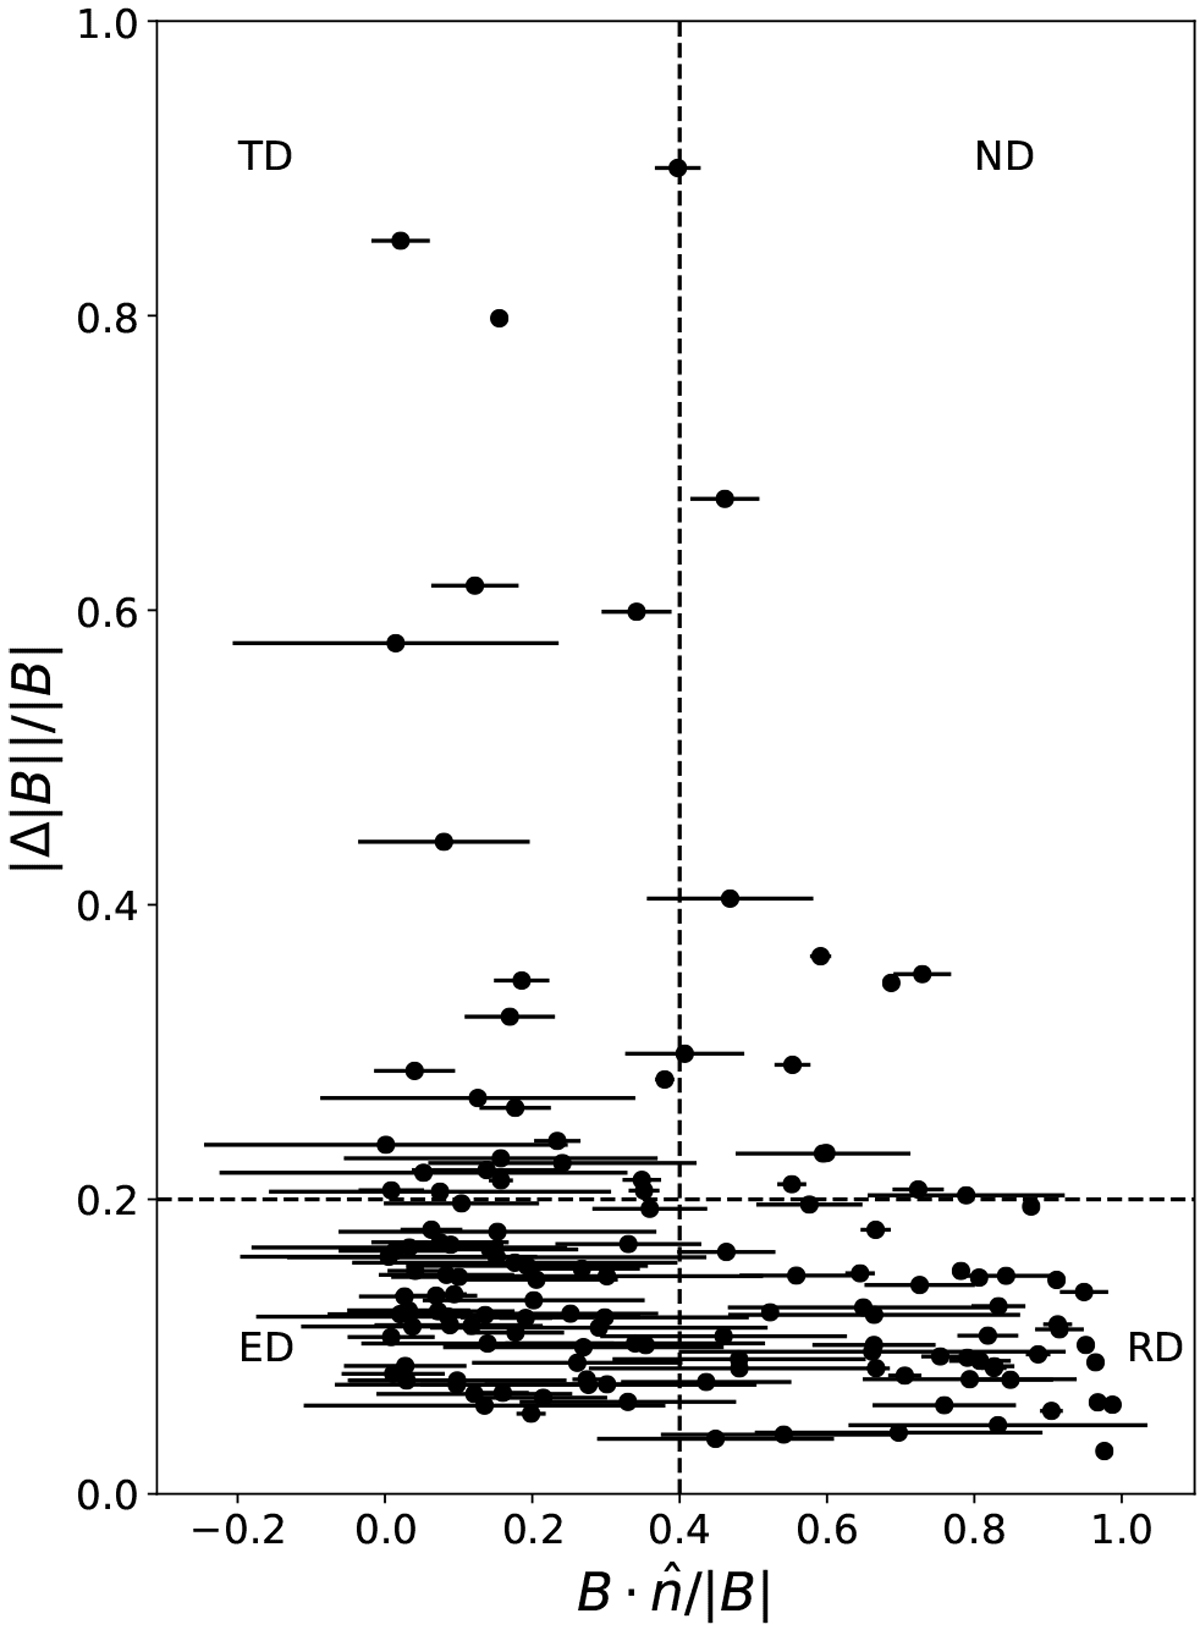
Boundary classification comparing the field threading through the discontinuity surface normalized to the field magnitude (x axis) andthe highest median magnetic field magnitude between the two sides of the discontinuity (y axis). The dotted lines separate different types of discontinuities. The ±1σ error bars in the x direction were estimated by block bootstrapping.
Current usage metrics show cumulative count of Article Views (full-text article views including HTML views, PDF and ePub downloads, according to the available data) and Abstracts Views on Vision4Press platform.
Data correspond to usage on the plateform after 2015. The current usage metrics is available 48-96 hours after online publication and is updated daily on week days.
Initial download of the metrics may take a while.