Fig. 3
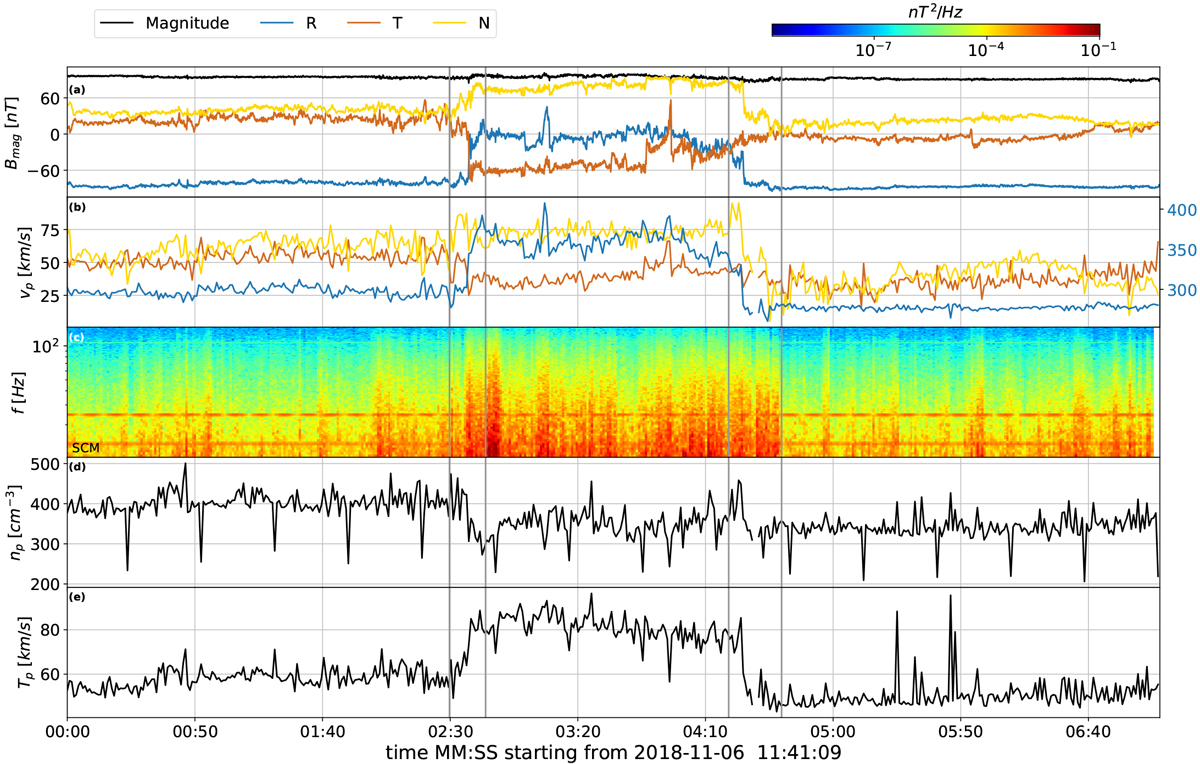
Switchback example. Panel a: MAG magnetic field data; (b): proton velocity; (c): trace spectrogram from the SCM waveform; (d): proton density; and (e): proton temperature. Leading and trailing edges are located between the first and second pairsof vertical lines, respectively.
Current usage metrics show cumulative count of Article Views (full-text article views including HTML views, PDF and ePub downloads, according to the available data) and Abstracts Views on Vision4Press platform.
Data correspond to usage on the plateform after 2015. The current usage metrics is available 48-96 hours after online publication and is updated daily on week days.
Initial download of the metrics may take a while.