Fig. 2
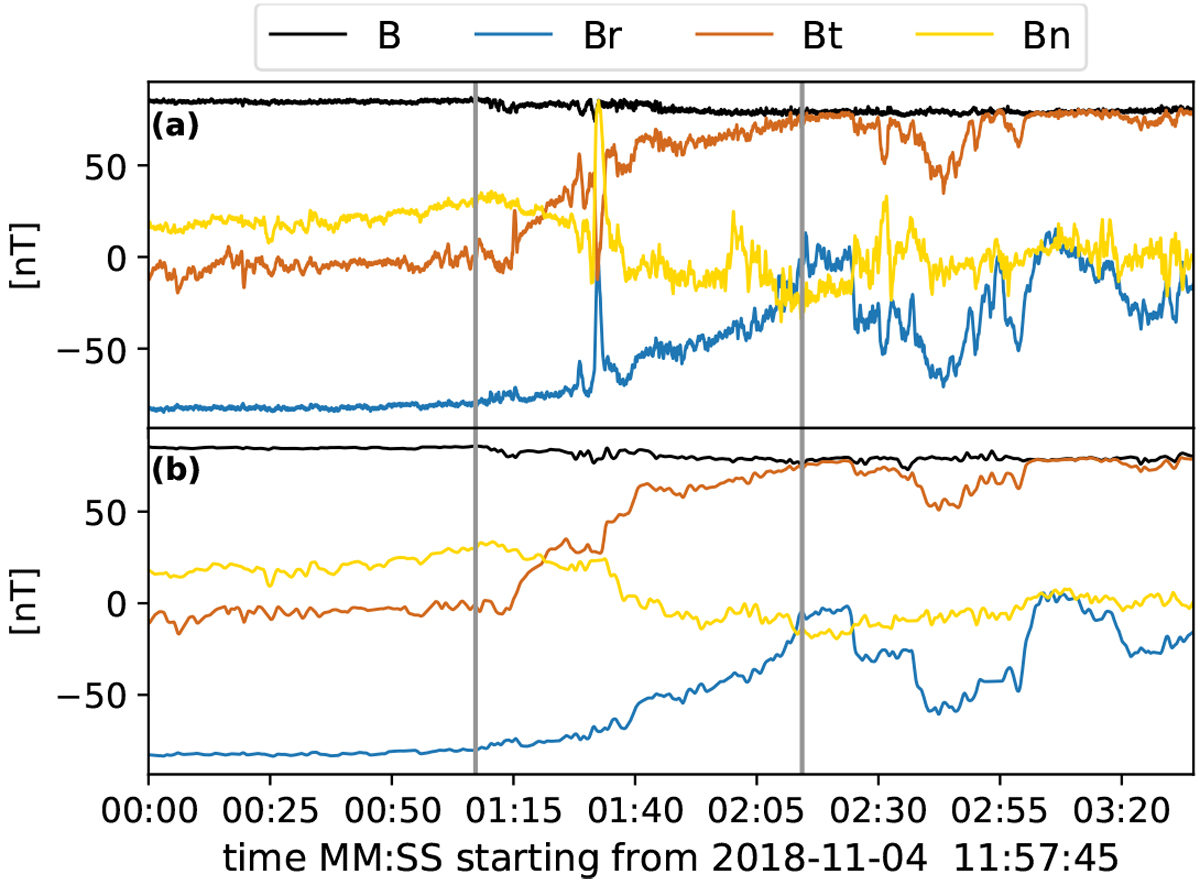
Example of a spike at the leading edge of a switchback. Upper panel: three components and the amplitude of the original MAG data. Lower panel: same data after running a median filter with a 10-s window (five times the duration of the spike) and low-pass filtering. The leading edge of the switchback is located between the gray vertical lines.
Current usage metrics show cumulative count of Article Views (full-text article views including HTML views, PDF and ePub downloads, according to the available data) and Abstracts Views on Vision4Press platform.
Data correspond to usage on the plateform after 2015. The current usage metrics is available 48-96 hours after online publication and is updated daily on week days.
Initial download of the metrics may take a while.