Fig. 1
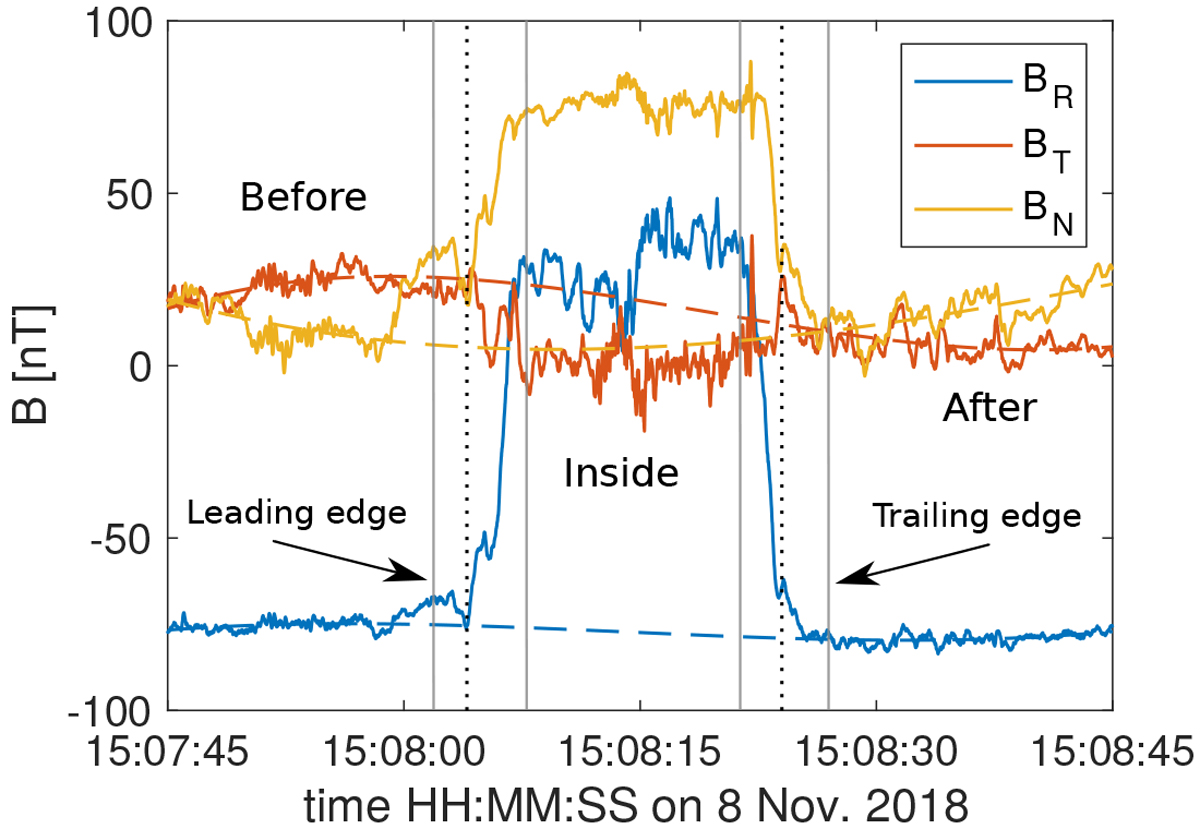
Typical switchback with a strong deflection and well defined edges. The leading and trailing edges are found between the gray vertical lines. Dashed lines represent the slow evolution of the magnetic field as if no switchbacks were occurring; they are also meant to reveal a potential departure of the magnetic field from that trend when approaching the switchback. These trends were obtained from a third order polynomial approximation that was adjusted to the magnetic field up to 5s before the onset of the leading edge of the switchback and starting again 5 s after the end of the trailing edge. These transitions are indicated by vertical dotted lines.
Current usage metrics show cumulative count of Article Views (full-text article views including HTML views, PDF and ePub downloads, according to the available data) and Abstracts Views on Vision4Press platform.
Data correspond to usage on the plateform after 2015. The current usage metrics is available 48-96 hours after online publication and is updated daily on week days.
Initial download of the metrics may take a while.