Fig. 4
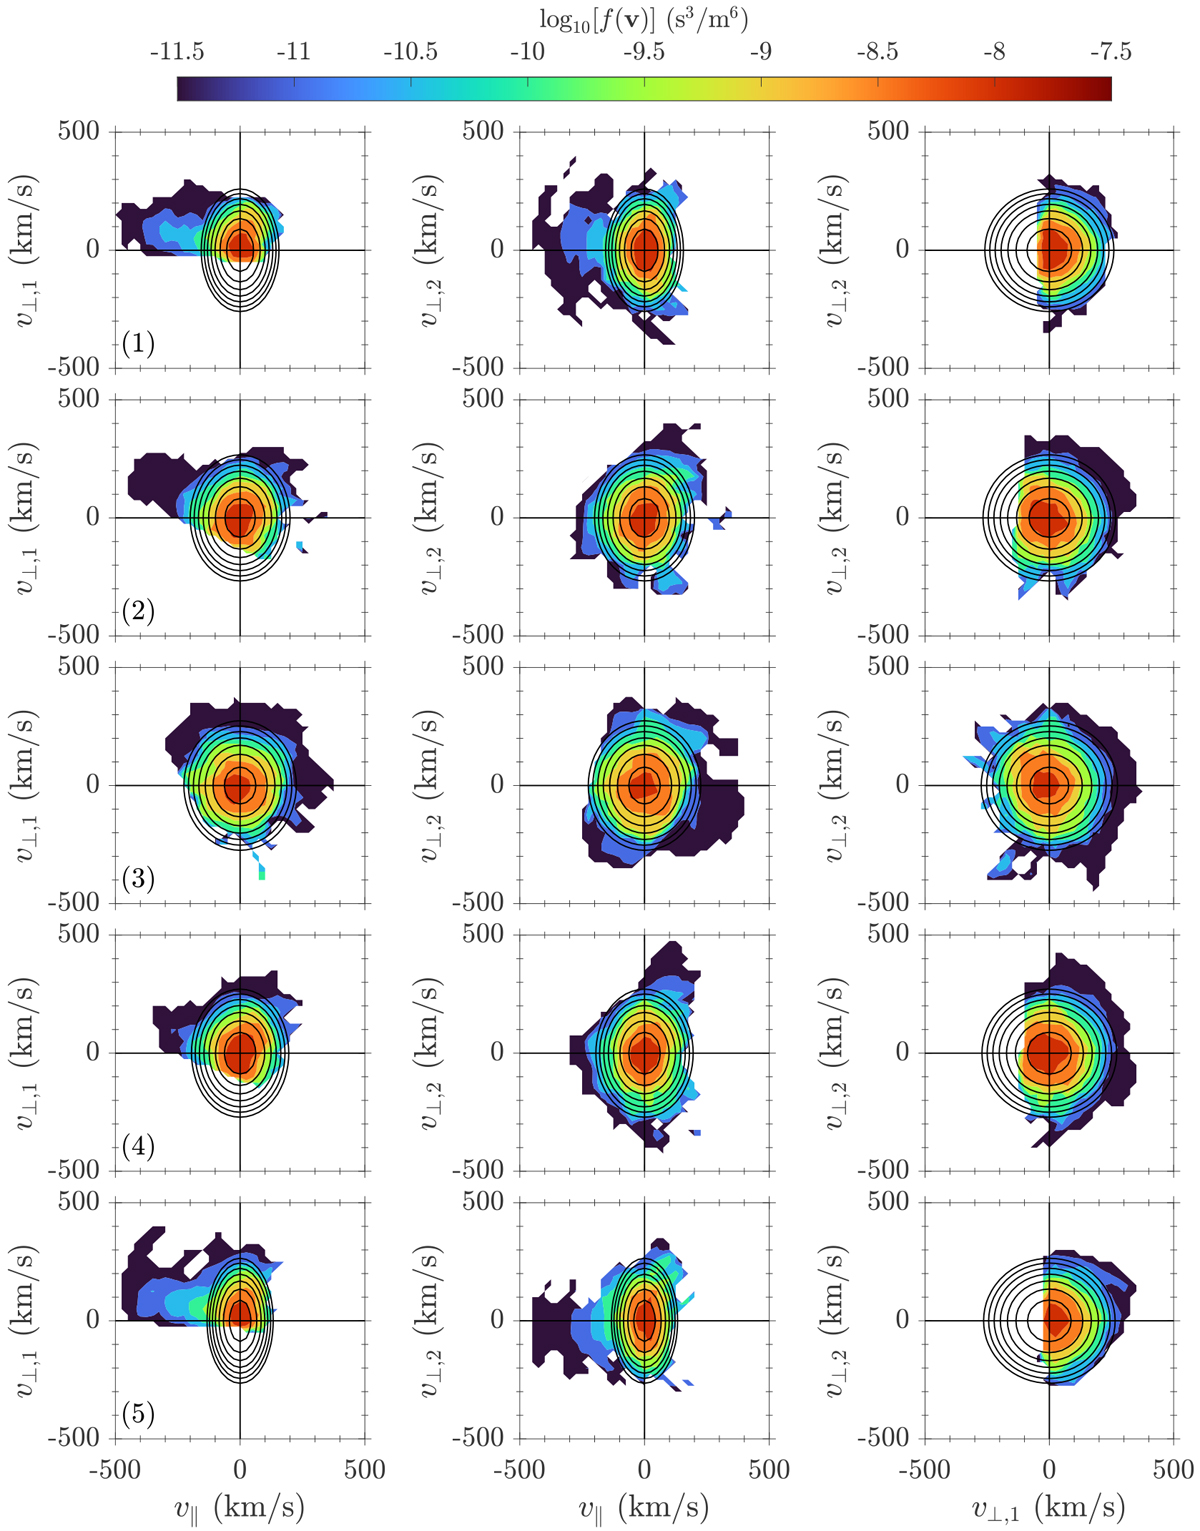
Examples of proton distributions measured by SPAN-Ai during the patch shown in Fig. 3 where each row corresponds to the times indicated. Each column gives a cut of the measured proton distribution in the proton core bulk frame, i.e. the core is centred on (0, 0). For example the left column is a cut through the distribution in the v∥-v⊥,1 plane at v⊥,2 = 0. We also include our bi-Maxwellian fits as contours, showing overall good agreement with the distributions.
Current usage metrics show cumulative count of Article Views (full-text article views including HTML views, PDF and ePub downloads, according to the available data) and Abstracts Views on Vision4Press platform.
Data correspond to usage on the plateform after 2015. The current usage metrics is available 48-96 hours after online publication and is updated daily on week days.
Initial download of the metrics may take a while.