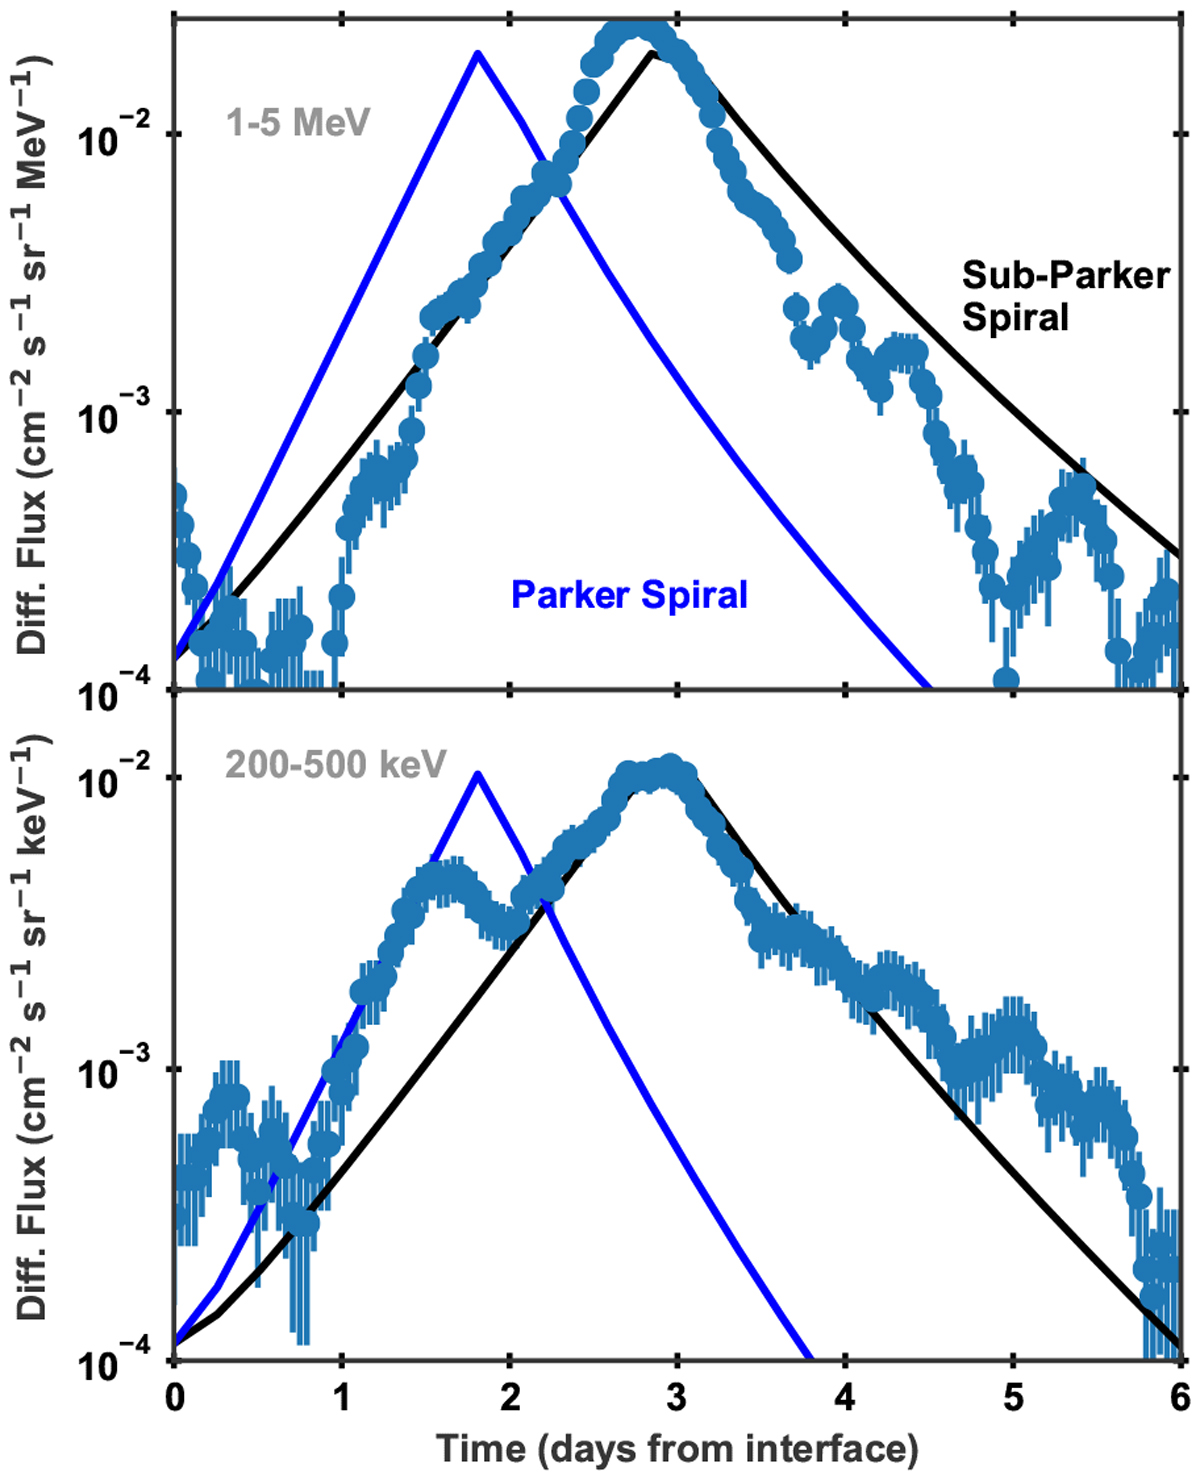
Fig. 4

Comparison between observed (blue data points) and modeled (curves) differential fluxes at higher and lower energies. Modeled energetic particles are accelerated at the SIR reverse compression or shock and propagate back to PSP along sub-Parker field lines (black curves) and Parker field lines (blue curves). Observed differential fluxes (averaged over 1–5 MeV, top, and 200–500 keV, bottom) are compared with modeled fluxes (2 MeV, top, and 250 keV, bottom).
Current usage metrics show cumulative count of Article Views (full-text article views including HTML views, PDF and ePub downloads, according to the available data) and Abstracts Views on Vision4Press platform.
Data correspond to usage on the plateform after 2015. The current usage metrics is available 48-96 hours after online publication and is updated daily on week days.
Initial download of the metrics may take a while.


