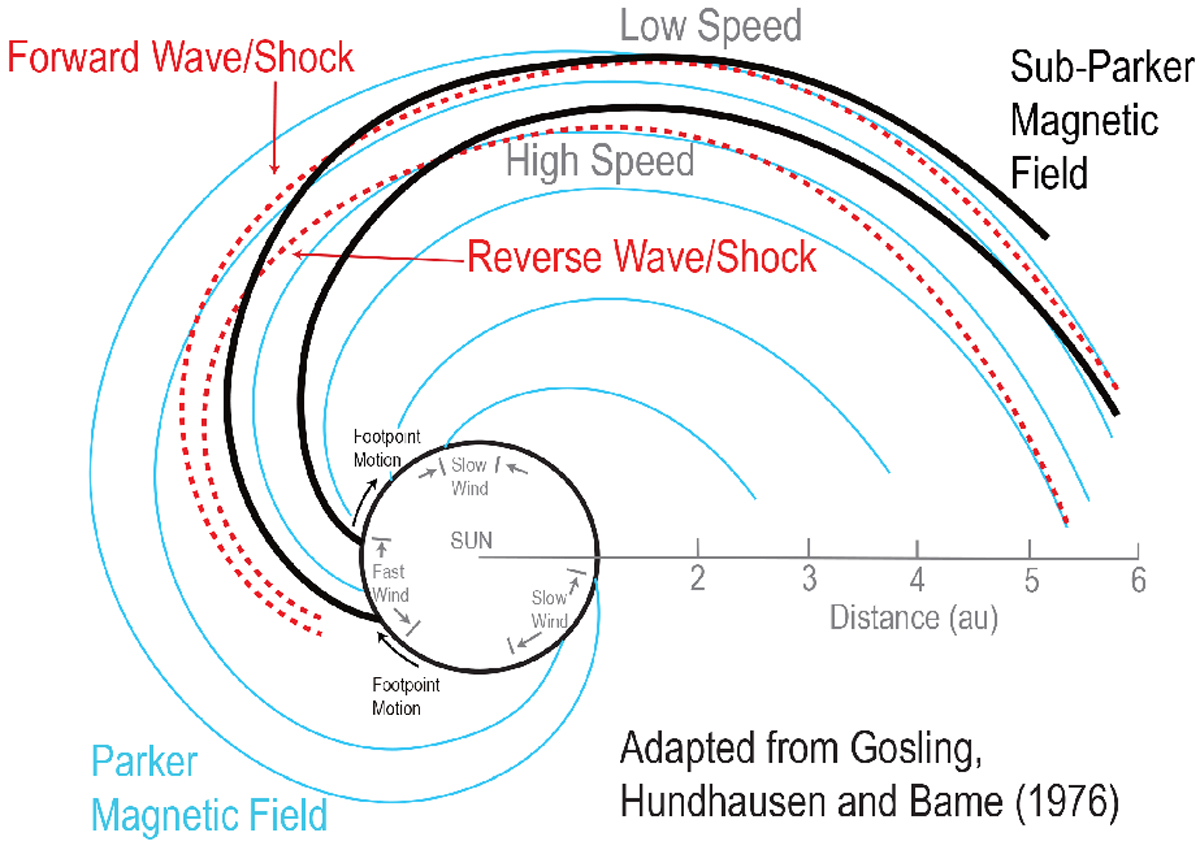
Fig. 2

Illustration of the magnetic field structure in a stream interaction region (SIR) adapted from Gosling et al. (1976). Within SIRs, Faster solar wind overtakes slower solar wind, forming a compression or shock (red dashed curves). The Parker Spiral magnetic field lines are shown as thin blue curves. With footpoint motion at the Sun, magnetic field lines (black curves) are connected between fast and slow solar wind and form the sub-Parker spiral (Murphy et al. 2002; Schwadron & McComas 2005; Schwadron et al. 2005) in rarefaction regions where the fast solar wind stretches out magnetic field lines in the radial direction.
Current usage metrics show cumulative count of Article Views (full-text article views including HTML views, PDF and ePub downloads, according to the available data) and Abstracts Views on Vision4Press platform.
Data correspond to usage on the plateform after 2015. The current usage metrics is available 48-96 hours after online publication and is updated daily on week days.
Initial download of the metrics may take a while.


