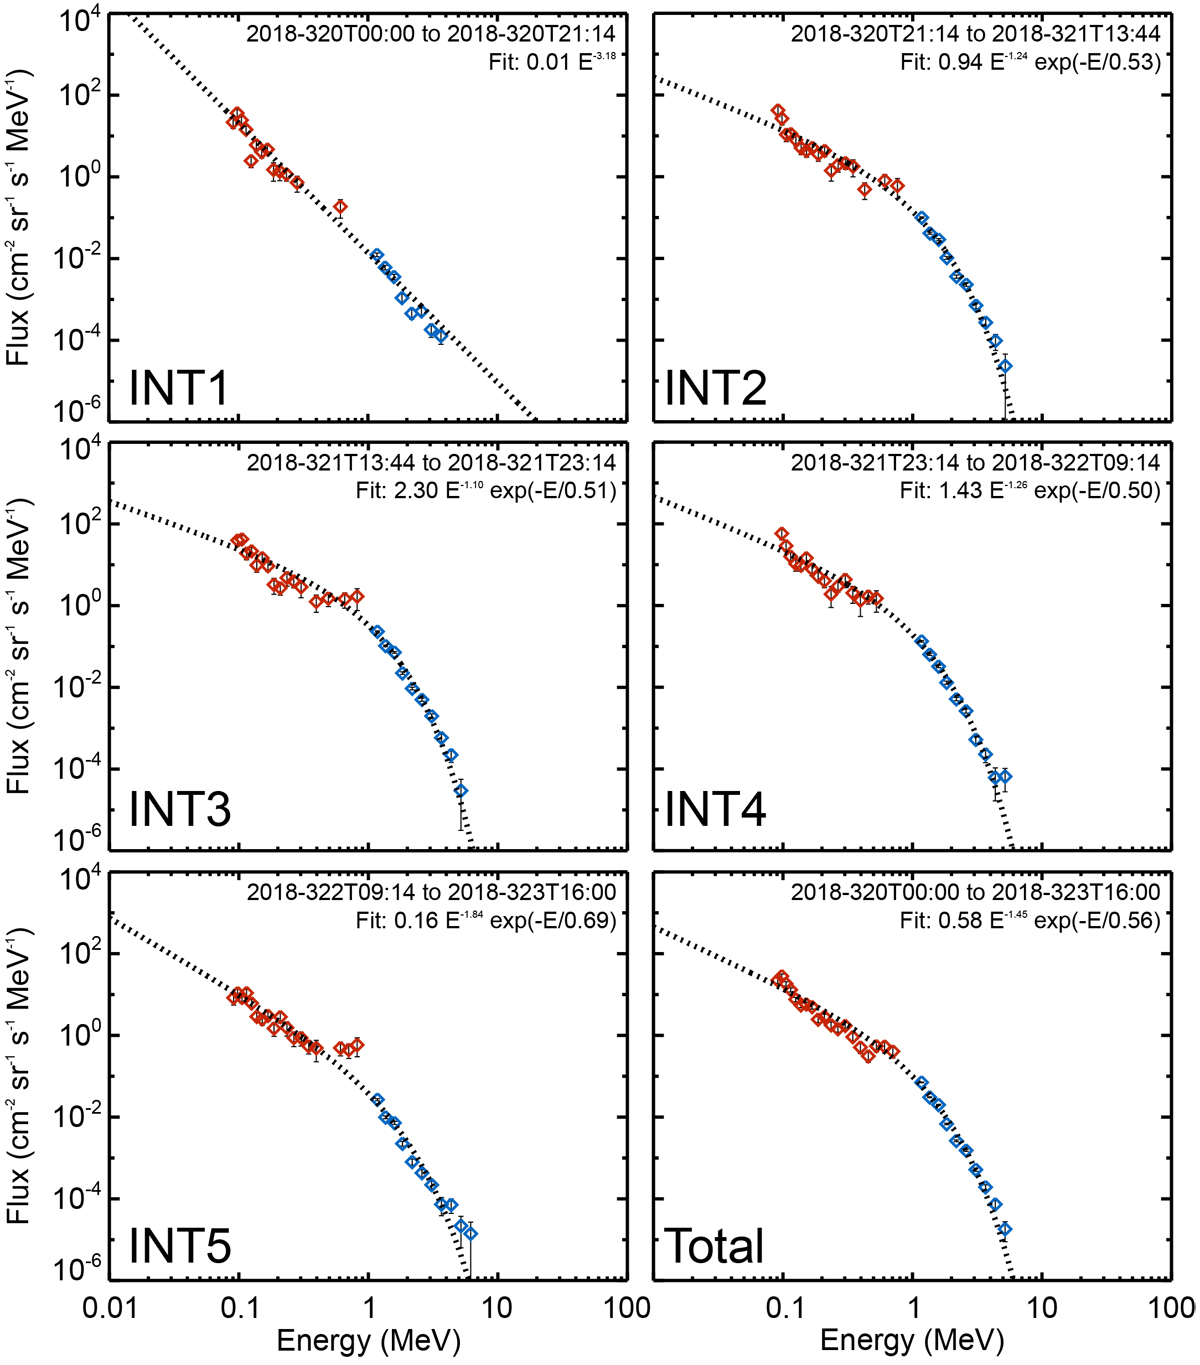
Fig. 3

Proton spectra for five intervals during the SIR-related energetic particle event observed by PSP/IS⊙IS on DOY 320of 2018. Red and blue symbols represent low and high energy instruments, respectively, and spectral fits are indicated bydotted black lines. Error bars (often smaller than the symbols) show the statistical uncertainty. To combat the reduced statistics of the triple coincidence EPI-Lo data, re-binning is applied following background subtraction such that each plotted point has at least two counts.
Current usage metrics show cumulative count of Article Views (full-text article views including HTML views, PDF and ePub downloads, according to the available data) and Abstracts Views on Vision4Press platform.
Data correspond to usage on the plateform after 2015. The current usage metrics is available 48-96 hours after online publication and is updated daily on week days.
Initial download of the metrics may take a while.


