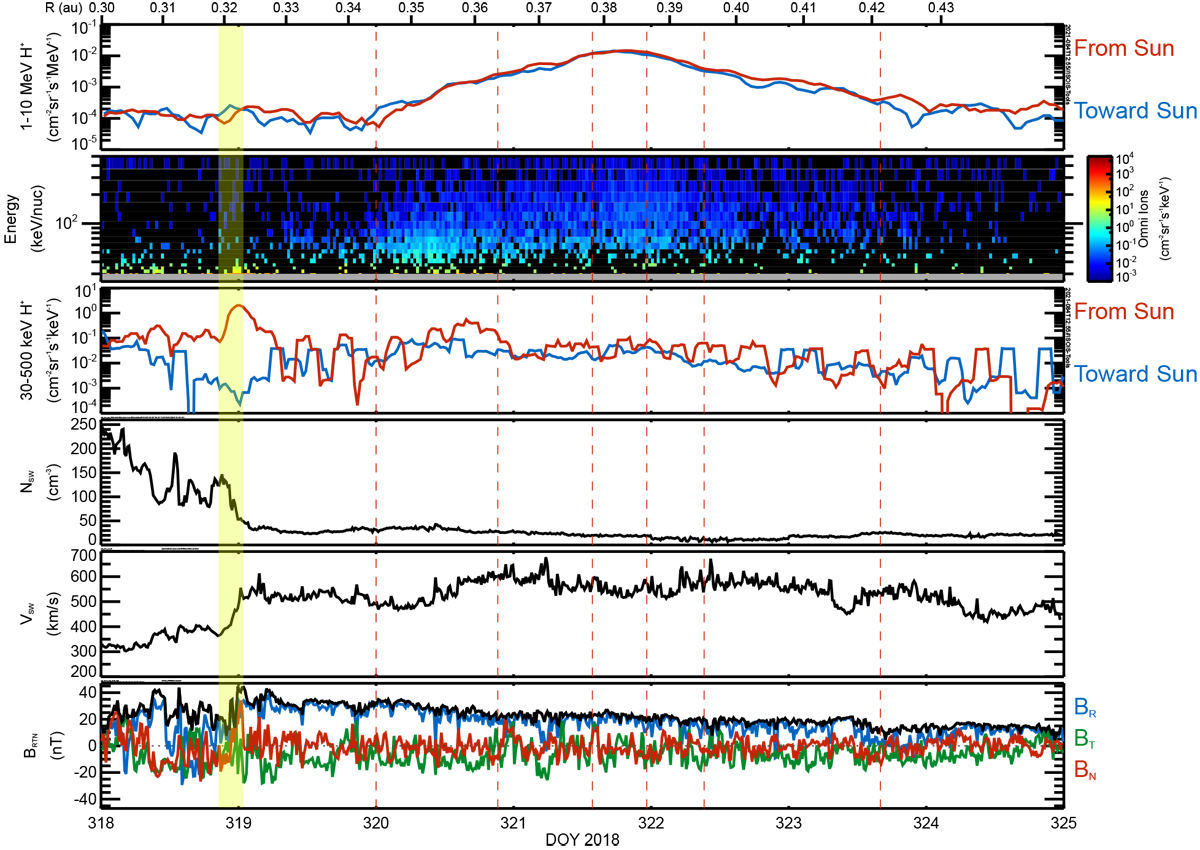
Fig. 2

Overview of the SIR-related event beginning on DOY 320 of 2018. Top three panels: energetic proton enhancements extending for almost four days. Panels 4 and 5: plasma conditions during this period as measured by the Solar Wind Electrons Alphas and Protons (SWEAP) instrument (Kasper et al. 2016); the associated compression region passing over the spacecraft near the beginning of DOY 319 is highlighted in yellow. Bottom panel: magnetic field as measured by the FIELDS instrument (Bale et al. 2016) in RTN (radial, tangential, normal) coordinates (see Fränz & Harper 2002), showing a highly radial field over this time period. Dotted red lines indicate the divisions between periods used for spectral analysis. The EPI-Lo, plasma, and magnetic field data are averaged over 15-min intervals, while the EPI-Hi data is hourly. No background subtraction has been applied to the data shown here.
Current usage metrics show cumulative count of Article Views (full-text article views including HTML views, PDF and ePub downloads, according to the available data) and Abstracts Views on Vision4Press platform.
Data correspond to usage on the plateform after 2015. The current usage metrics is available 48-96 hours after online publication and is updated daily on week days.
Initial download of the metrics may take a while.


