Fig. 2
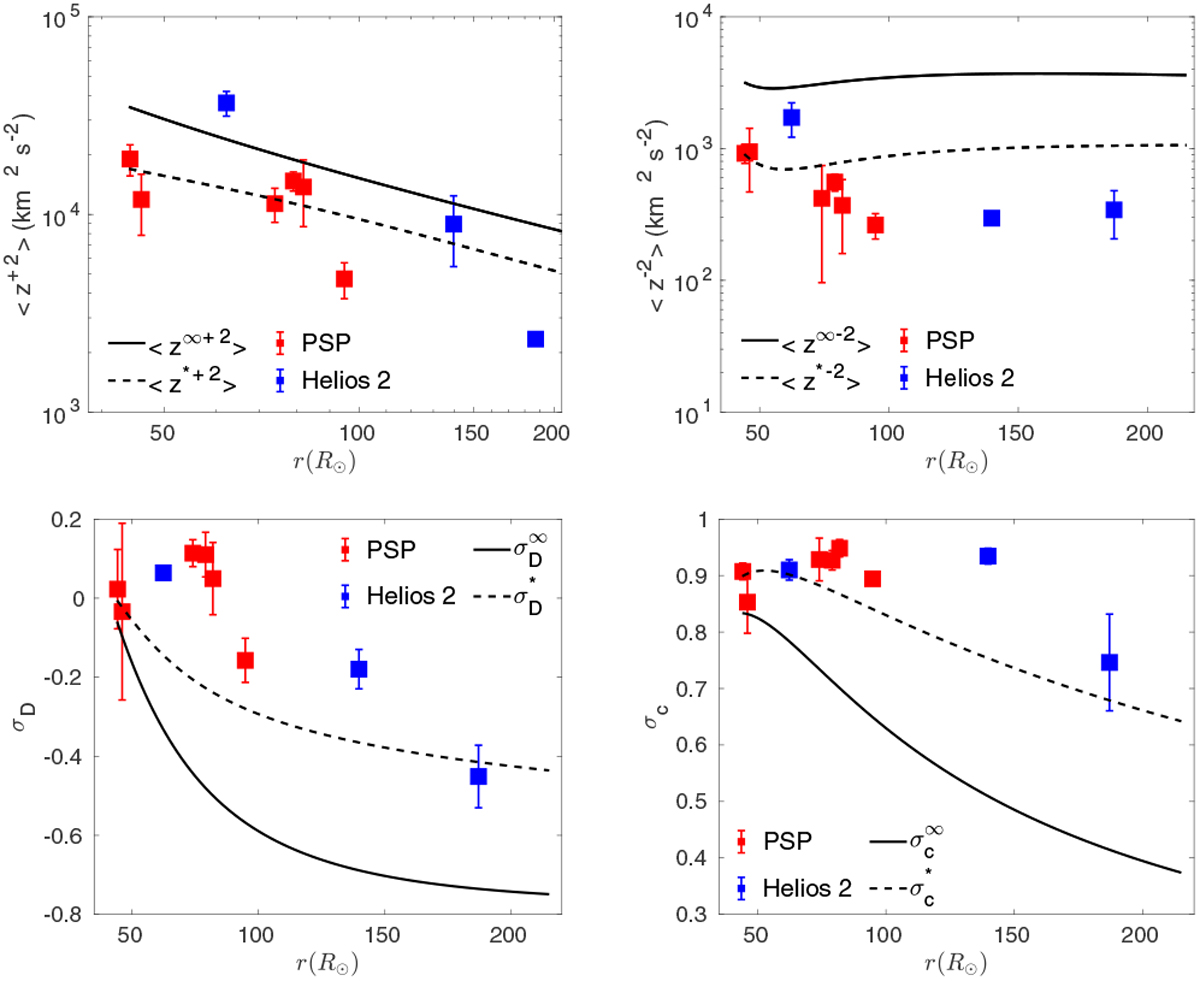
Comparison between the theoretical and observed turbulent quantities as a function of heliocentric distance. Top left and right panels: energy in forward and backward propagating modes. Bottom left and right: normalized residual energy and the normalized cross-helicity. The solid curve denotes the quasi-2D component, and the dashed curve represents the slab component. The red and blue squares are the observed quantities measured by PSP and Helios 2 with error bars, respectively.
Current usage metrics show cumulative count of Article Views (full-text article views including HTML views, PDF and ePub downloads, according to the available data) and Abstracts Views on Vision4Press platform.
Data correspond to usage on the plateform after 2015. The current usage metrics is available 48-96 hours after online publication and is updated daily on week days.
Initial download of the metrics may take a while.