Fig. 1
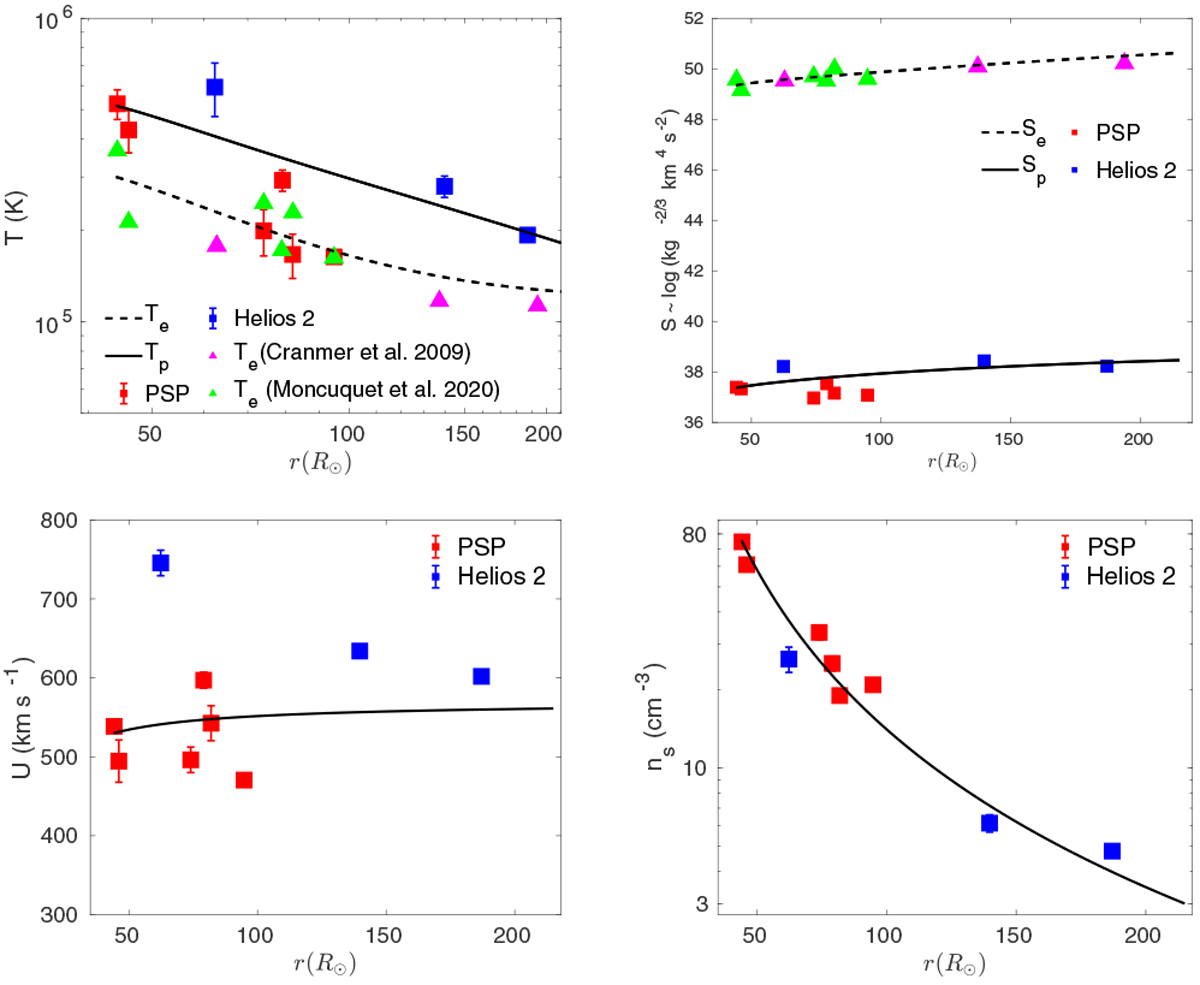
Comparison between the theoretical (solid and dashed curves) and observed solar wind plasma parameters as a function of heliocentric distance. The red and blue squares are the observed results with error bars. Top left: solar wind electron and proton temperature. Top right: solar wind proton and electron entropy. Bottom left: solar wind speed. Bottom right: solar wind density.
Current usage metrics show cumulative count of Article Views (full-text article views including HTML views, PDF and ePub downloads, according to the available data) and Abstracts Views on Vision4Press platform.
Data correspond to usage on the plateform after 2015. The current usage metrics is available 48-96 hours after online publication and is updated daily on week days.
Initial download of the metrics may take a while.