Fig. 9.
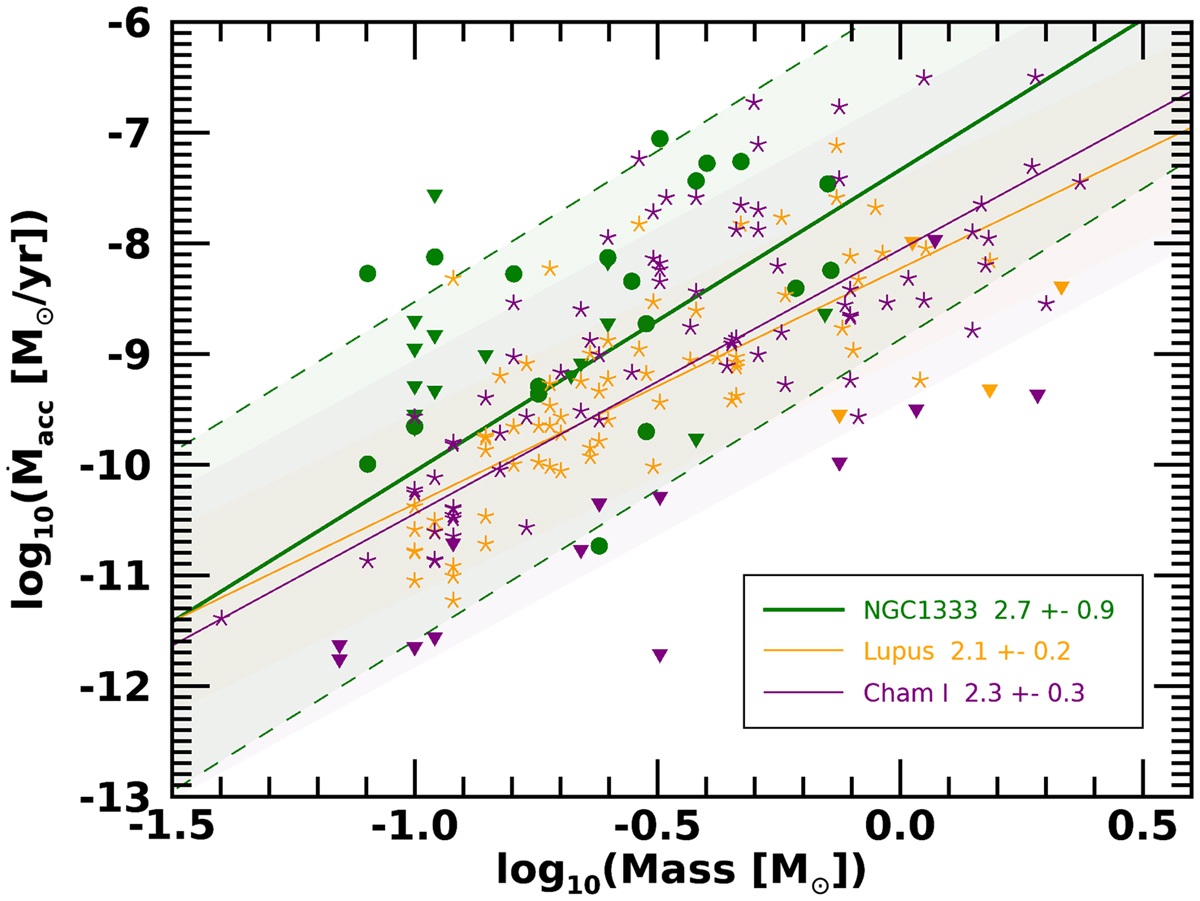
Mass accretion rate as a function of stellar mass for the NGC 1333 Class II sample (green). Detections are displayed as filled circles, while upper limits are shown as triangles. Orange and purple stars represent Lupus and Cha I sources, respectively. Solid lines show the best fit for each star-forming region as specified in the legend, and the standard deviation from the best fit is shown with dashed lines. The subluminous target is highlighted with a red box.
Current usage metrics show cumulative count of Article Views (full-text article views including HTML views, PDF and ePub downloads, according to the available data) and Abstracts Views on Vision4Press platform.
Data correspond to usage on the plateform after 2015. The current usage metrics is available 48-96 hours after online publication and is updated daily on week days.
Initial download of the metrics may take a while.