Free Access
Fig. 5.
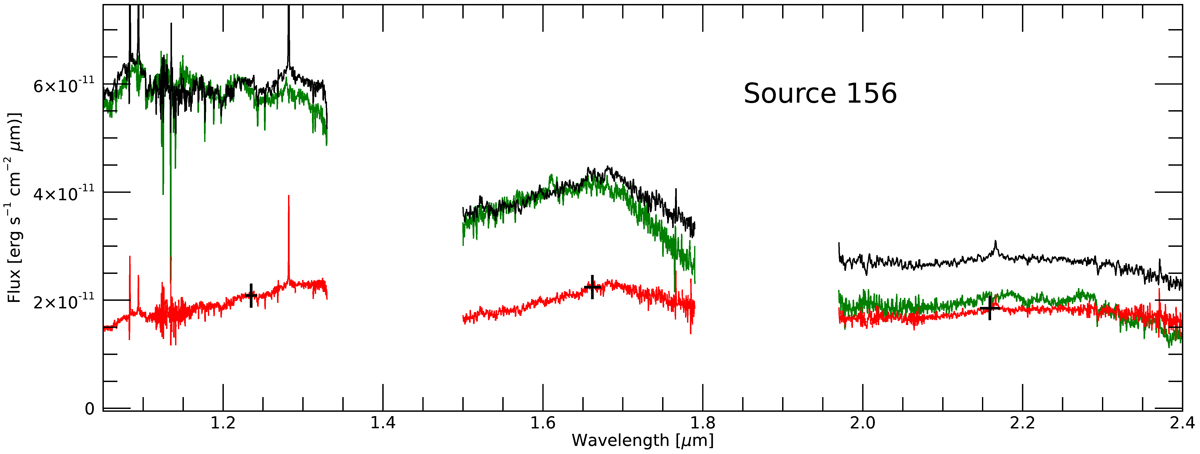
Example of the spectral typing result for Class II source #156. The observed spectrum is shown in red. The dereddened spectrum (black) matches the spectrum of an M6.5 Class III (green) from Manara et al. (2013). The difference in the K band is due to the fact that source #156 is accreting, while the Class III is not.
Current usage metrics show cumulative count of Article Views (full-text article views including HTML views, PDF and ePub downloads, according to the available data) and Abstracts Views on Vision4Press platform.
Data correspond to usage on the plateform after 2015. The current usage metrics is available 48-96 hours after online publication and is updated daily on week days.
Initial download of the metrics may take a while.