Fig. 4.
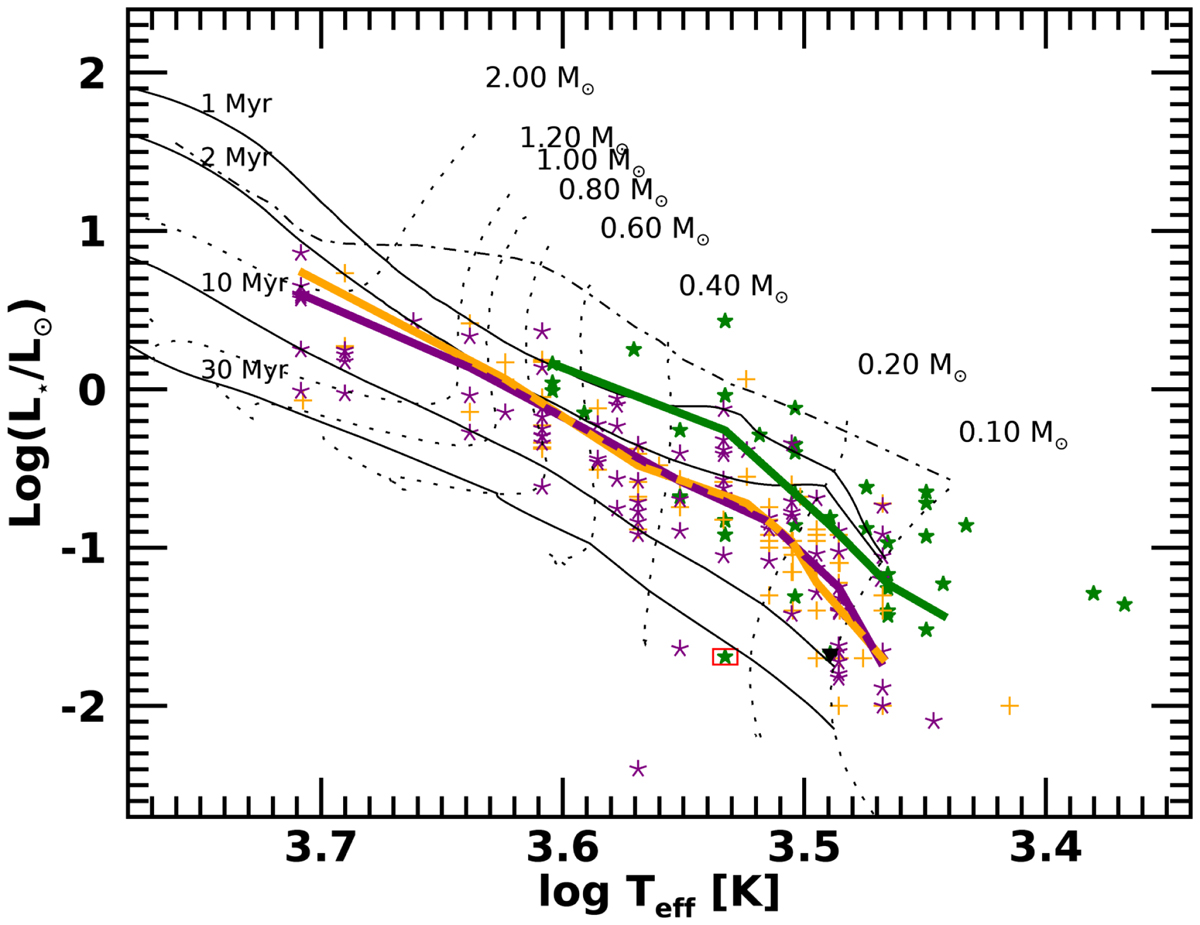
HR diagram for the Class II YSOs of NGC 1333 (green stars), Lupus (orange crosses), and Cha I (purple asterisks). The green, orange, and purple lines correspond to the median of NGC 1333, Lupus, and Cha I samples (sub-luminous objects are not included), respectively. The birthline (Palla & Stahler 1993) is plotted as a dot-dashed line. Black solid and dashed lines show the isochrones and evolutionary tracks by Siess et al. (2000).
Current usage metrics show cumulative count of Article Views (full-text article views including HTML views, PDF and ePub downloads, according to the available data) and Abstracts Views on Vision4Press platform.
Data correspond to usage on the plateform after 2015. The current usage metrics is available 48-96 hours after online publication and is updated daily on week days.
Initial download of the metrics may take a while.