Fig. 3.
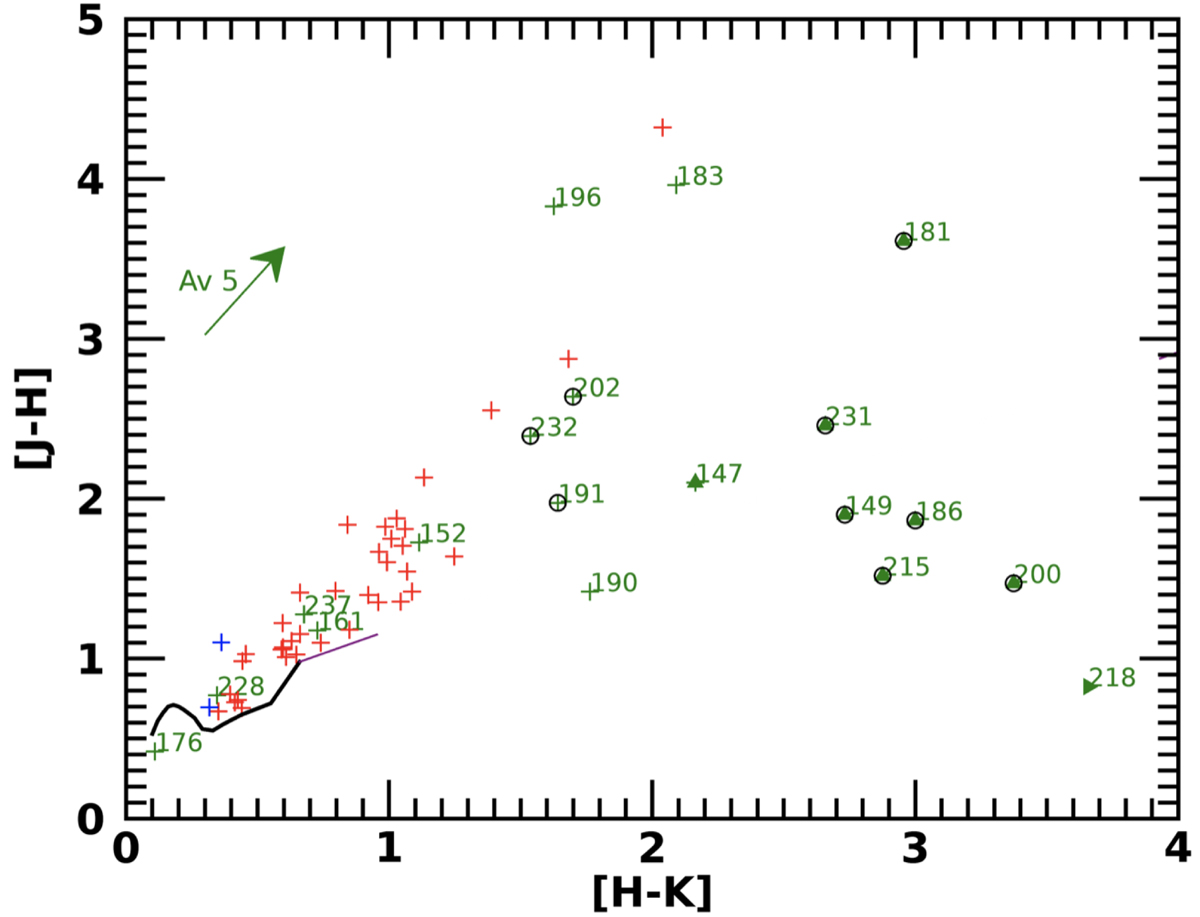
Colour–colour diagram of our sample. Class I, II, and III YSOs are plotted as green, red, and blue crosses, respectively. Triangles are lower limits. Class I YSOs which show HI in emission are surrounded by a black circle. The main sequence (MS, Luhman et al. 2010) and CTT locus (Meyer et al. 1997) are shown in black and purple, respectively. The green arrow in the left-top corner defines the reddening direction, following the Cardelli et al. (1989) extinction law. Its length corresponds to AV = 5 mag.
Current usage metrics show cumulative count of Article Views (full-text article views including HTML views, PDF and ePub downloads, according to the available data) and Abstracts Views on Vision4Press platform.
Data correspond to usage on the plateform after 2015. The current usage metrics is available 48-96 hours after online publication and is updated daily on week days.
Initial download of the metrics may take a while.