Fig. 13.
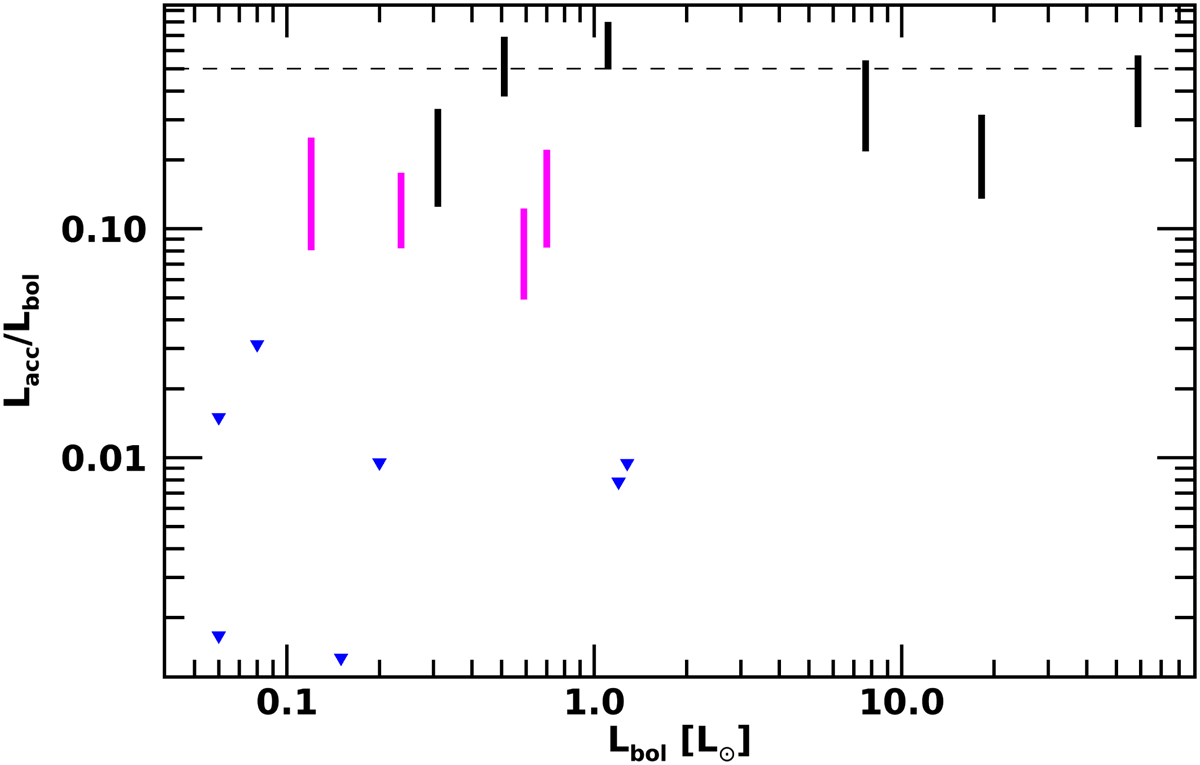
Lacc/Lbol ratio plotted as a function of the bolometric luminosity of our Class I sample. Low-veiled sources are plotted in magenta, and high-veiled ones are in black. Blue triangles are the upper limits for the Class I/Flat YSOs which show no HI detection. The horizontal dashed line represents the accretion luminosity fraction above which a source is in the main accretion phase.
Current usage metrics show cumulative count of Article Views (full-text article views including HTML views, PDF and ePub downloads, according to the available data) and Abstracts Views on Vision4Press platform.
Data correspond to usage on the plateform after 2015. The current usage metrics is available 48-96 hours after online publication and is updated daily on week days.
Initial download of the metrics may take a while.