Free Access
Fig. 11.
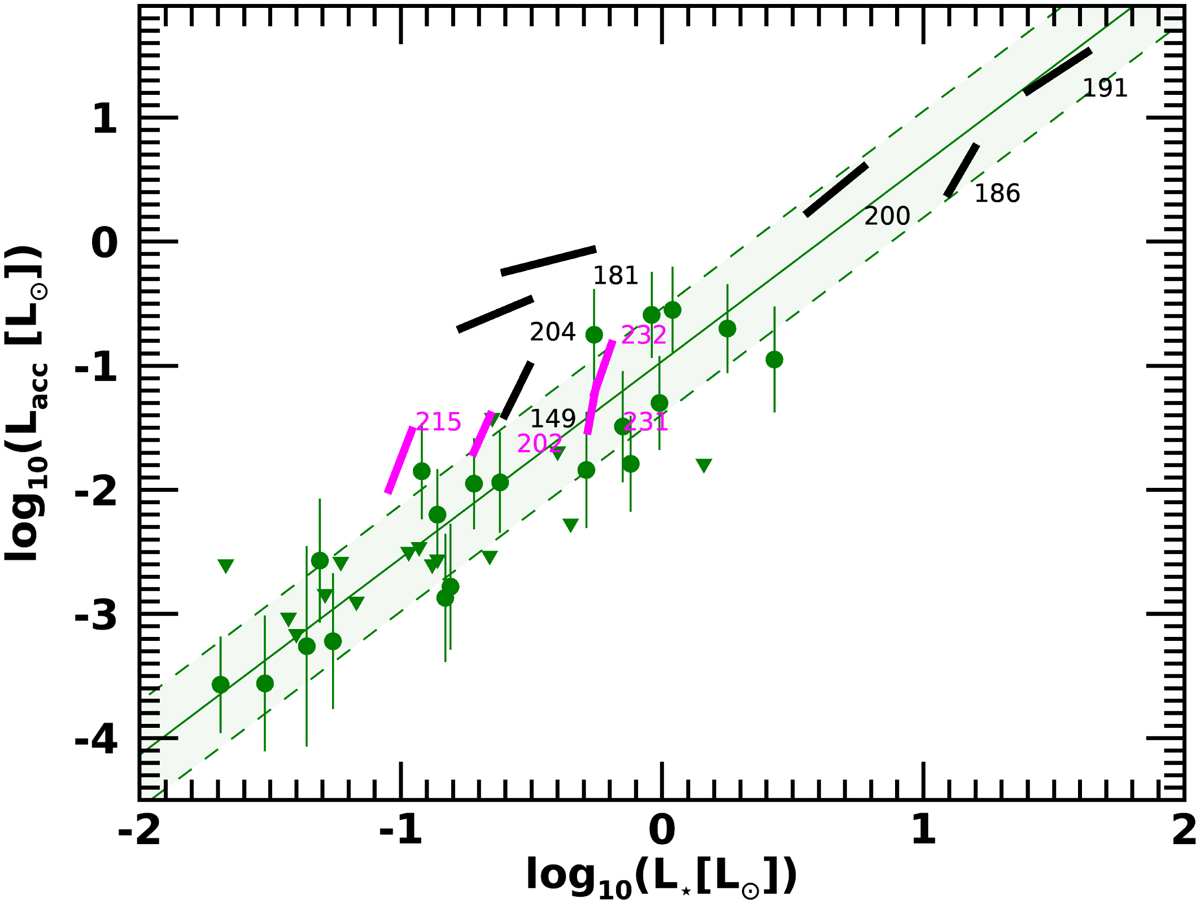
Accretion luminosity as a function of stellar luminosity for NGC 1333. The Class II sample is shown as in Fig. 7; Class I sources with veiling between 1 and 3 are plotted in magenta, while those with veiling between 3 and 8 are in black.
Current usage metrics show cumulative count of Article Views (full-text article views including HTML views, PDF and ePub downloads, according to the available data) and Abstracts Views on Vision4Press platform.
Data correspond to usage on the plateform after 2015. The current usage metrics is available 48-96 hours after online publication and is updated daily on week days.
Initial download of the metrics may take a while.