Free Access
Fig. 5
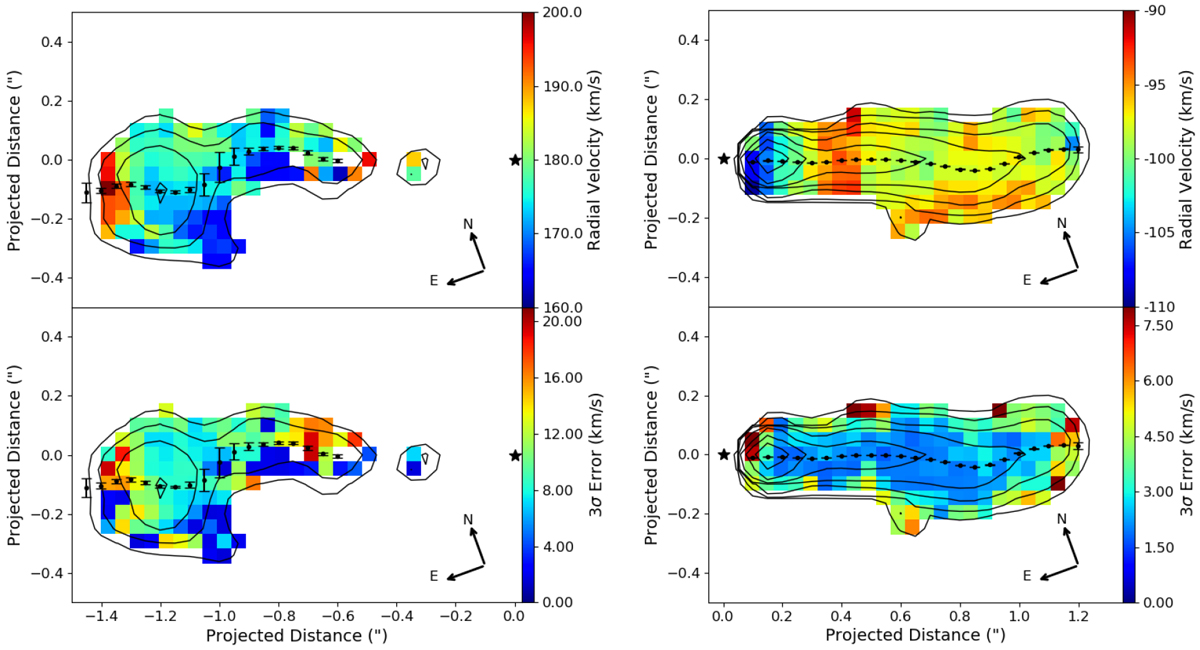
Centroid velocity map of the DO Tau bipolar jet, derived from Gaussian fitting the [Fe II] 1.64 μm line profile at each spaxel (see text for more details). Brightness contours from Fig. 1 are overlaid, along with the jet axis centroids. 3σ errors are given in the bottom panels.
Current usage metrics show cumulative count of Article Views (full-text article views including HTML views, PDF and ePub downloads, according to the available data) and Abstracts Views on Vision4Press platform.
Data correspond to usage on the plateform after 2015. The current usage metrics is available 48-96 hours after online publication and is updated daily on week days.
Initial download of the metrics may take a while.