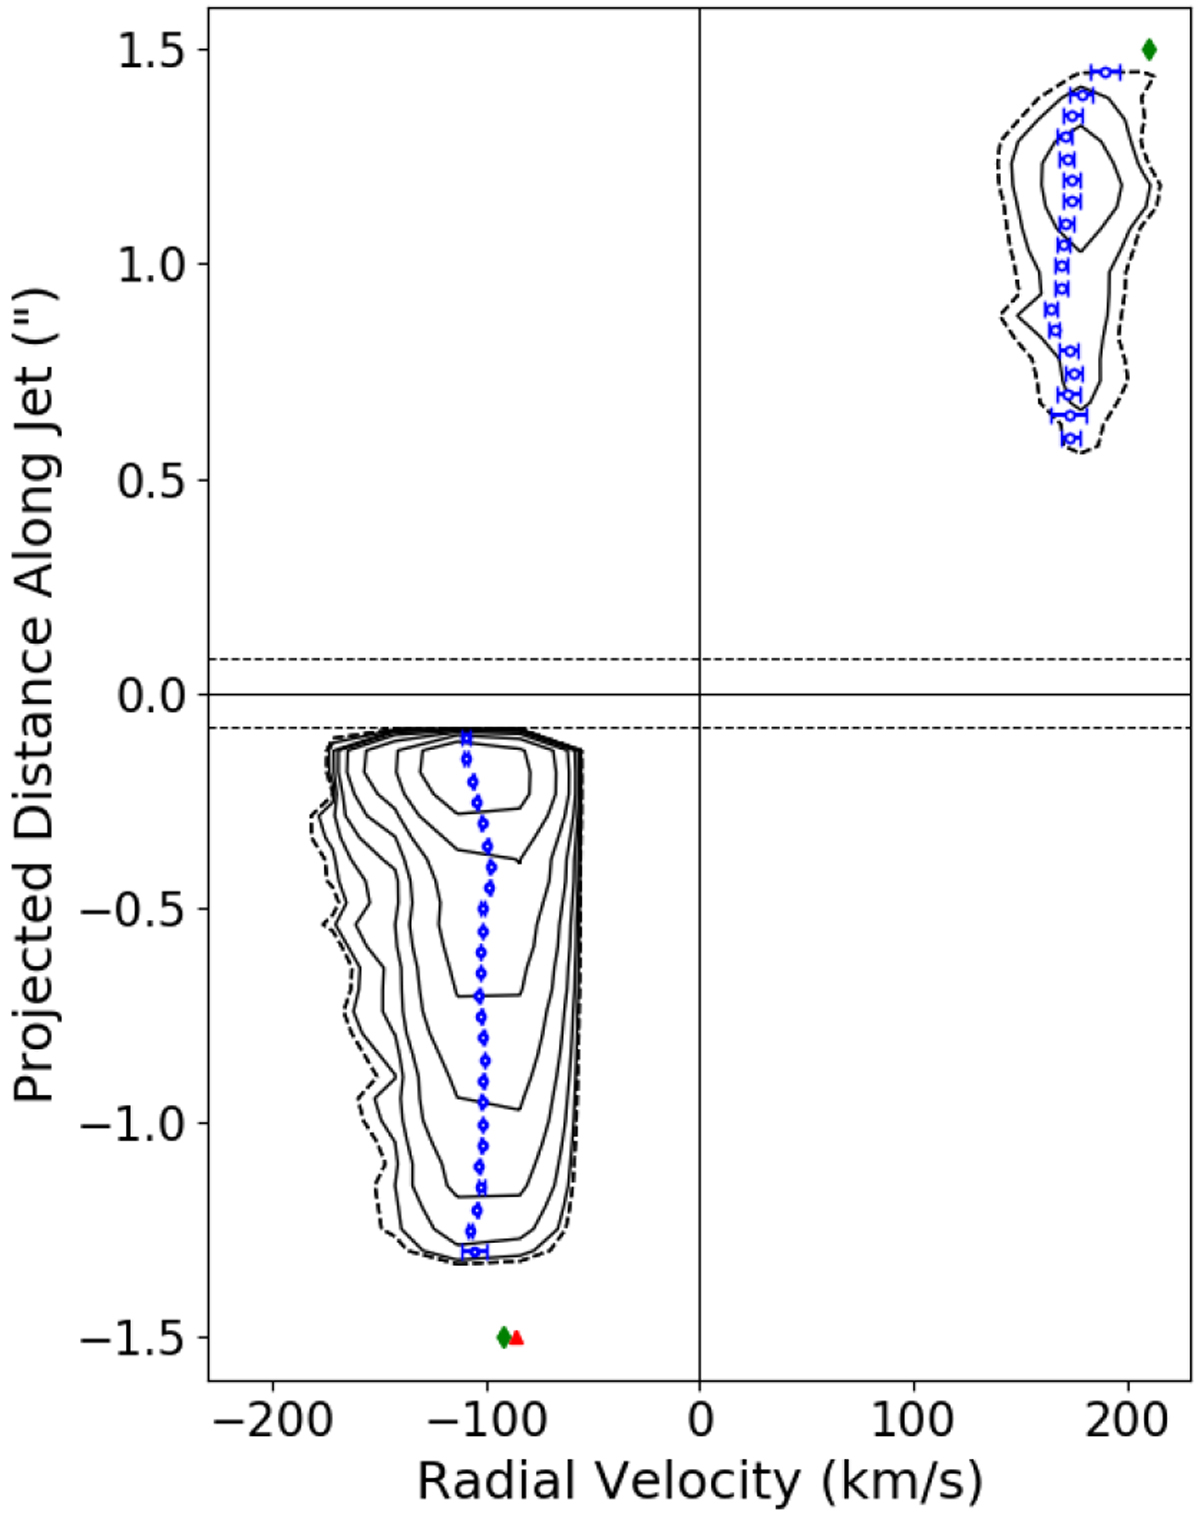
Fig. 3

Position–velocity diagram of the DO Tau bipolar jet in [Fe II] 1.64 μm emission along PA = 160° in a pseudo-slit of width 0.′′3. The contour floor is 3σ (solid line) and increases in log intervals of 0.3. Note that 2σ is also marked (dashed line), and 1σ = 3.5 × 10⁻¹⁶ erg s−1 cm−2 Å−1. The horizontal solid line marks the star position. The horizontal dashed lines mark the spatial resolution. The blue dashed line shows the variation of the peak velocity centroids, derived from Gaussian fitting to the line profiles. The green diamonds represent the centroid velocities found by Hirth et al. (1997); red triangle represents the velocity found by Giannini et al. (2019).
Current usage metrics show cumulative count of Article Views (full-text article views including HTML views, PDF and ePub downloads, according to the available data) and Abstracts Views on Vision4Press platform.
Data correspond to usage on the plateform after 2015. The current usage metrics is available 48-96 hours after online publication and is updated daily on week days.
Initial download of the metrics may take a while.


