Fig. A.1
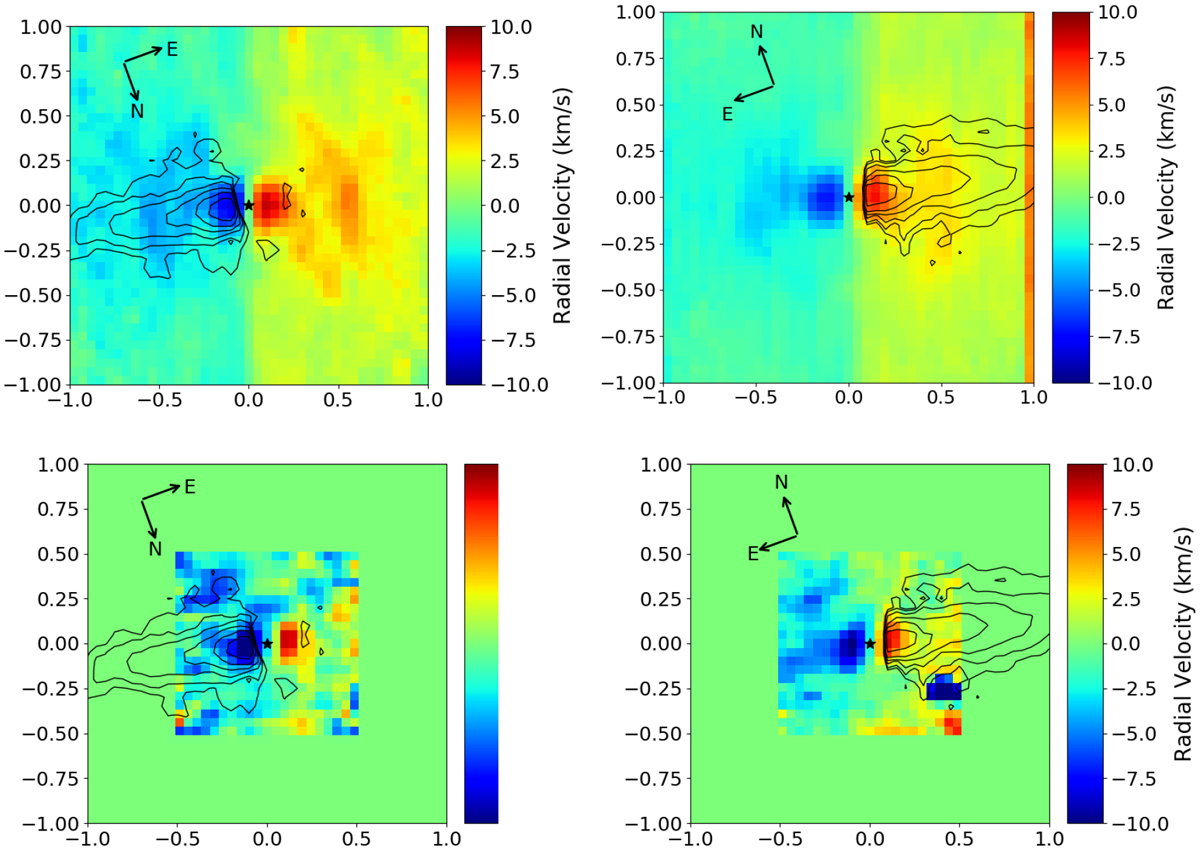
Maps of velocity corrections required as a result of uneven slit illumination, for both PA 160° (left) and PA 340° (right). Top panels are computed by modelling the uneven slit illumination effect in each spaxel. Bottom panels are measured velocity centroid shifts relative to the central spectrum for the photospheric line near 16 755 Å, as a double-check on the model output. Black contours show the position of the approaching jet.
Current usage metrics show cumulative count of Article Views (full-text article views including HTML views, PDF and ePub downloads, according to the available data) and Abstracts Views on Vision4Press platform.
Data correspond to usage on the plateform after 2015. The current usage metrics is available 48-96 hours after online publication and is updated daily on week days.
Initial download of the metrics may take a while.