Fig. 10
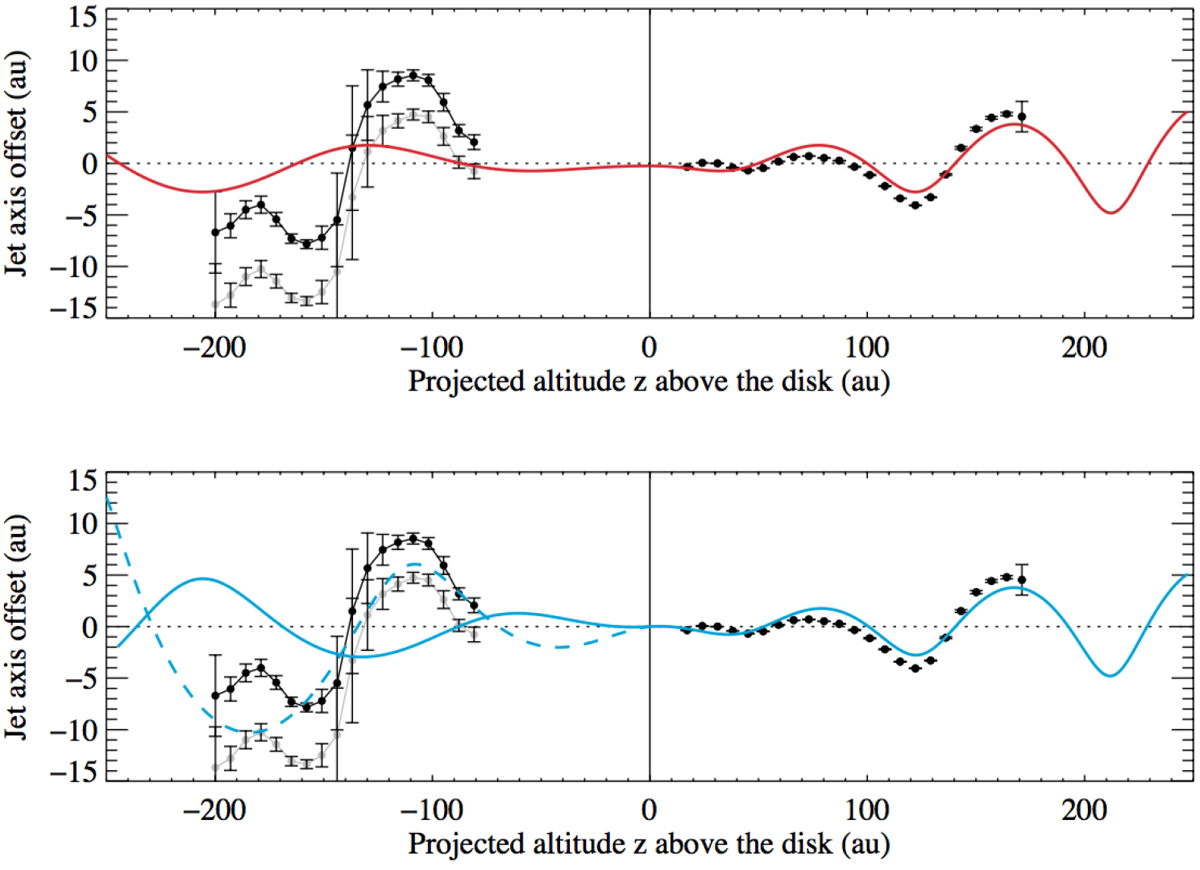
Wiggle in the jet axis of DO Tau: black dots with associated error bars show the jet axis displacement, measured with respect to the blue-shifted jet PA. On the red-shifted jet side (left), grey dots show measurements before correction for a possible misalignment of 1° of the red-shifted jet. Top panel: the red solid curve shows the orbital solution fitted to the blue-shifted jet axis wiggling. Bottom panel: the solid cyan curve shows the precession solution fitted to the blue-shifted jet axis wiggling. The dashed cyan curve shows the same precession solution computed for the red-shifted jet, but adjusted for a phase shift and an increased precession angle (by a factor 2.5). See text for more details.
Current usage metrics show cumulative count of Article Views (full-text article views including HTML views, PDF and ePub downloads, according to the available data) and Abstracts Views on Vision4Press platform.
Data correspond to usage on the plateform after 2015. The current usage metrics is available 48-96 hours after online publication and is updated daily on week days.
Initial download of the metrics may take a while.