Fig. 1
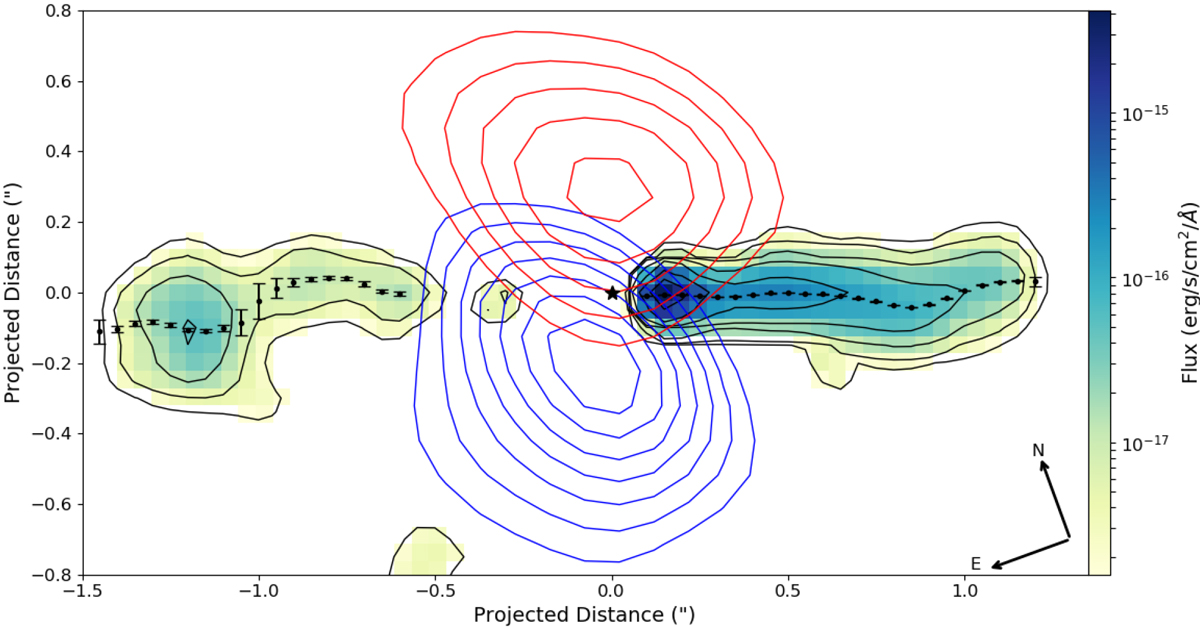
Deconvolved image of the DO Tau receding (left) and approaching (right) jet in Fe II 1.64 μm line, integrated over vLSR = [−122, 228] km s−1. The contour floor is 3σ increasing inlog intervals of 0.5 (where 1σ is 1.43 × 10⁻¹⁸ erg s−1 cm2 Å. The derivedjet axis position is overlaid in black dots with associated error bars. Rotating to the horizontal yields a blue-shifted jet position angle, PAjet = 260°. Blue and redcontours trace C18O emission integrated over vLSR = [4.21, 5.01] km s−1 and vLSR = [7.01, 7.61] km s−1 respectively. The contour floor is 3 σ (13 mJy beam−1), increasing inlinear intervals of 1 σ (4.5 mJy beam−1).
Current usage metrics show cumulative count of Article Views (full-text article views including HTML views, PDF and ePub downloads, according to the available data) and Abstracts Views on Vision4Press platform.
Data correspond to usage on the plateform after 2015. The current usage metrics is available 48-96 hours after online publication and is updated daily on week days.
Initial download of the metrics may take a while.