Fig. A.1.
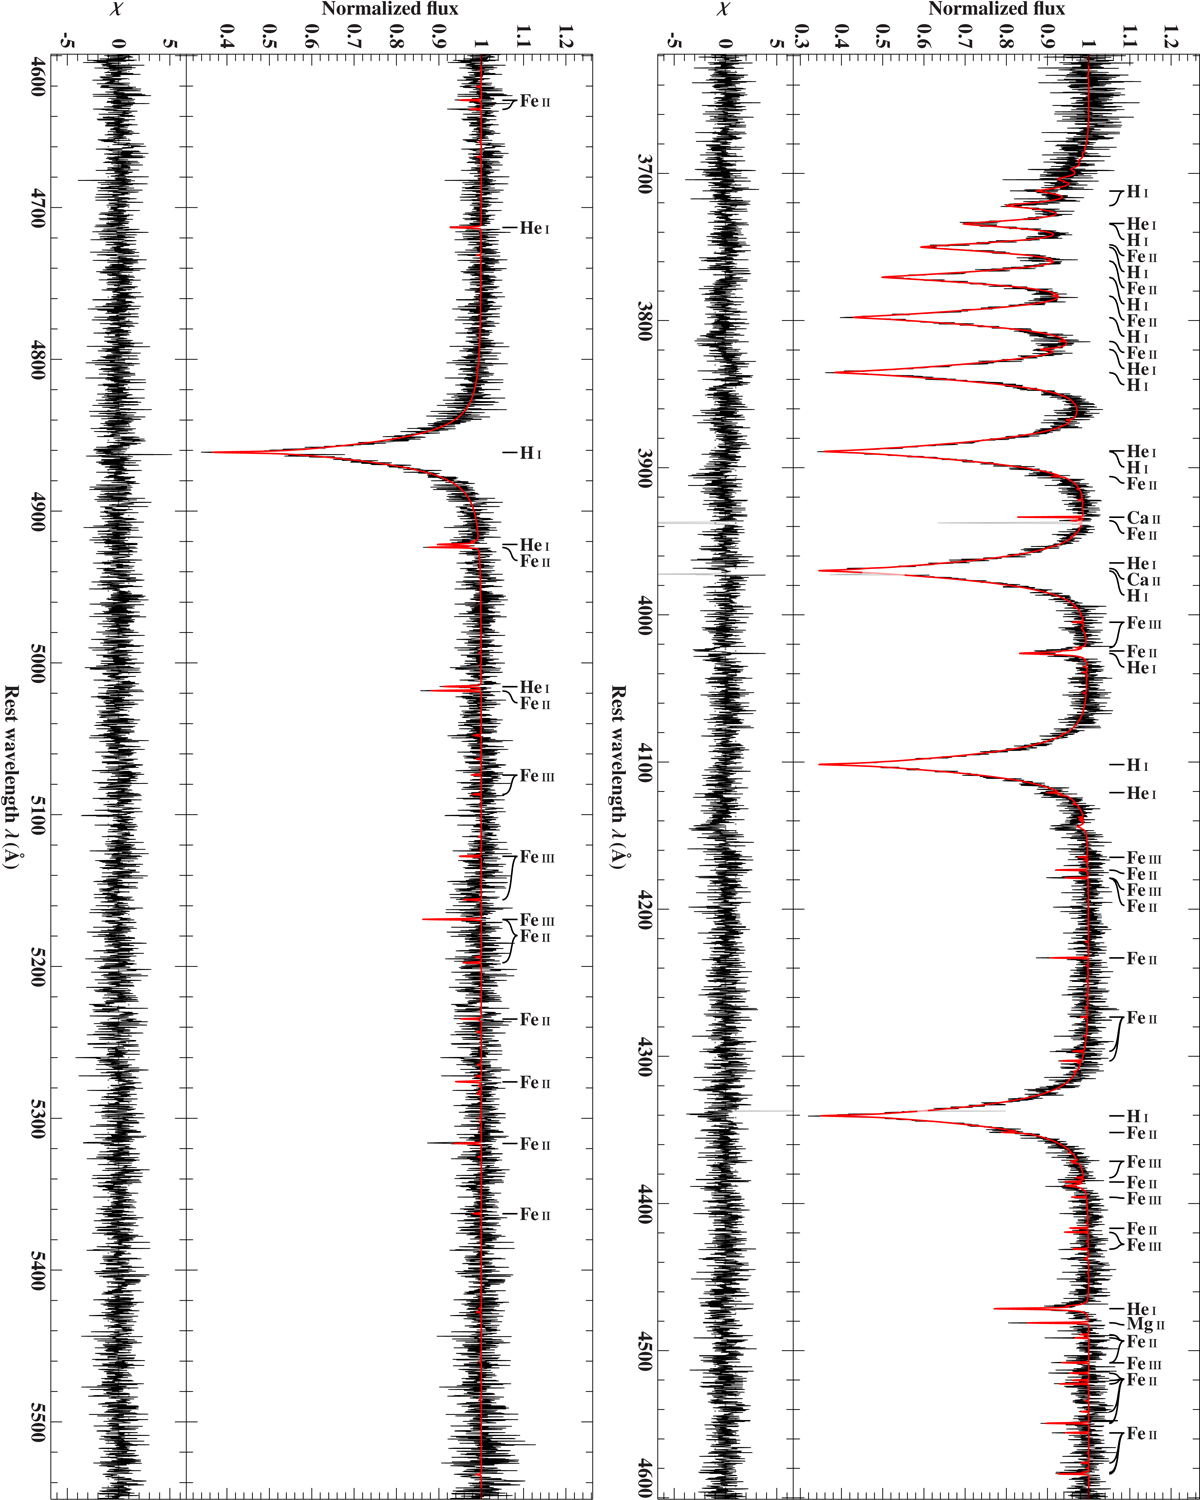
Exemplary comparison of the best fitting model spectrum (red line) with normalized observation (black line; X-shooter spectrum taken on March 23, 2019, i.e., 2 458 565.8693 HJD). Light colors mark regions that have been excluded from fitting, e.g., due to the presence of interstellar or telluric lines. Residuals, χ, are shown as well. The optical spectrum only exhibits lines of H, He, Mg, Ca, and Fe.
Current usage metrics show cumulative count of Article Views (full-text article views including HTML views, PDF and ePub downloads, according to the available data) and Abstracts Views on Vision4Press platform.
Data correspond to usage on the plateform after 2015. The current usage metrics is available 48-96 hours after online publication and is updated daily on week days.
Initial download of the metrics may take a while.