Fig. 4.
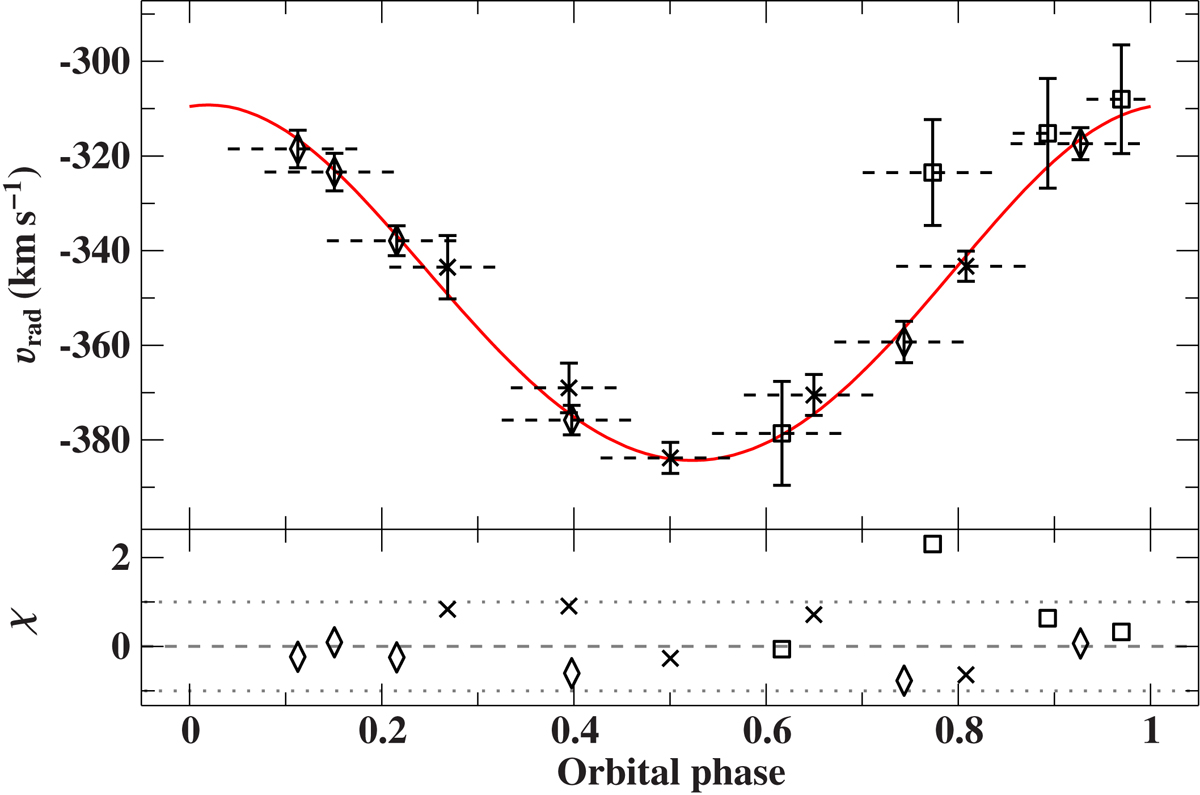
Phased radial-velocity curve. The measurements are represented by black symbols with 1σ error bars, and the best fitting Keplerian model is indicated by the solid red curve. The corresponding orbital parameters are given in Table 4. The ESI spectra are shown as crosses, ISIS spectra as open squares, and X-shooter spectra as open diamonds. The dashed horizontal lines indicate the individual exposure times over which the Keplerian curve is averaged before being compared with the measurements. The residuals, χ, are shown in the lower panel. An orbital phase of 0 corresponds to the pericenter passage.
Current usage metrics show cumulative count of Article Views (full-text article views including HTML views, PDF and ePub downloads, according to the available data) and Abstracts Views on Vision4Press platform.
Data correspond to usage on the plateform after 2015. The current usage metrics is available 48-96 hours after online publication and is updated daily on week days.
Initial download of the metrics may take a while.