Fig. 3.
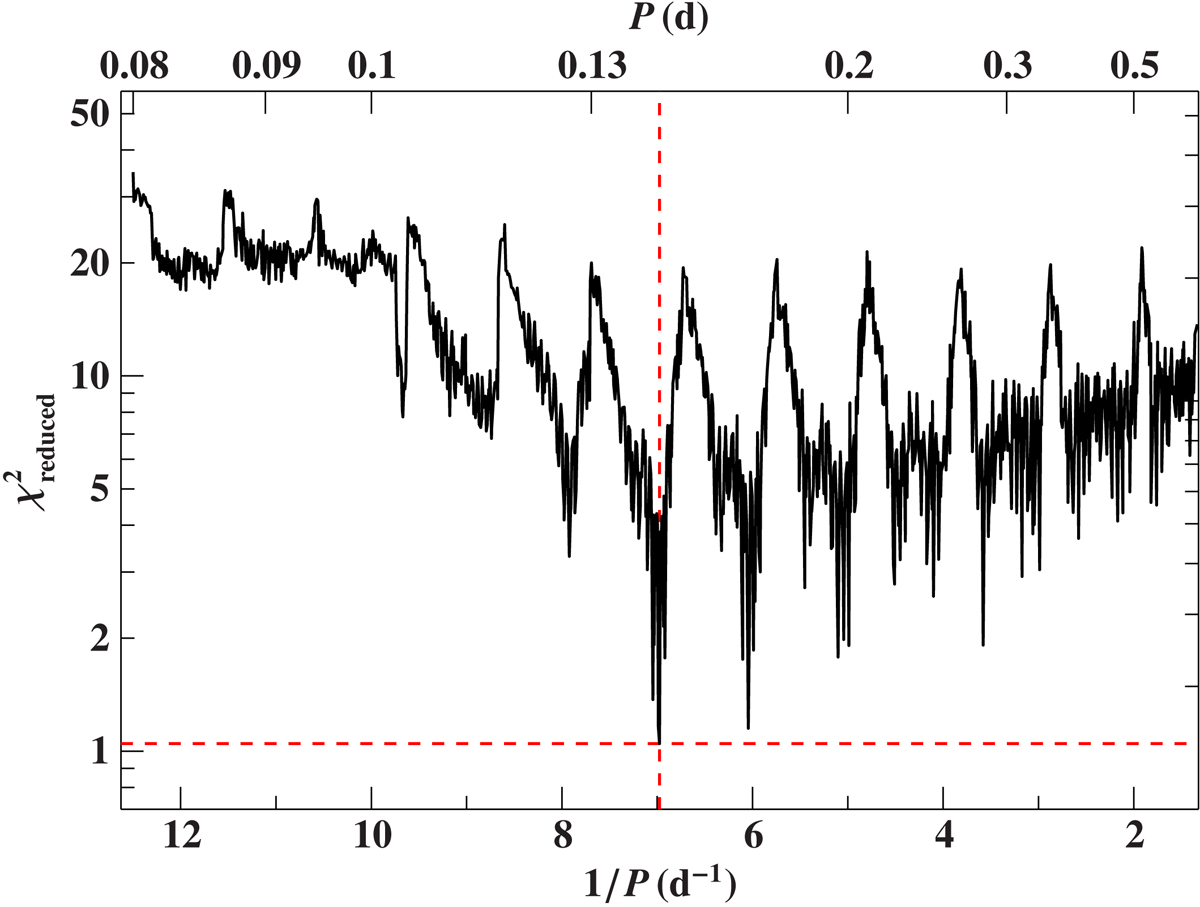
χ2 landscape (“periodogram”), which results from fitting the measured radial velocities with a Keplerian model, as a function of the orbital frequency or period. The step size in the orbital frequency was chosen such that phase shifts are always less than 0.01. A minimum filter has been applied to lower the number of points in the plot to a reasonable amount. The dashed red lines mark the best fit.
Current usage metrics show cumulative count of Article Views (full-text article views including HTML views, PDF and ePub downloads, according to the available data) and Abstracts Views on Vision4Press platform.
Data correspond to usage on the plateform after 2015. The current usage metrics is available 48-96 hours after online publication and is updated daily on week days.
Initial download of the metrics may take a while.