Fig. 1.
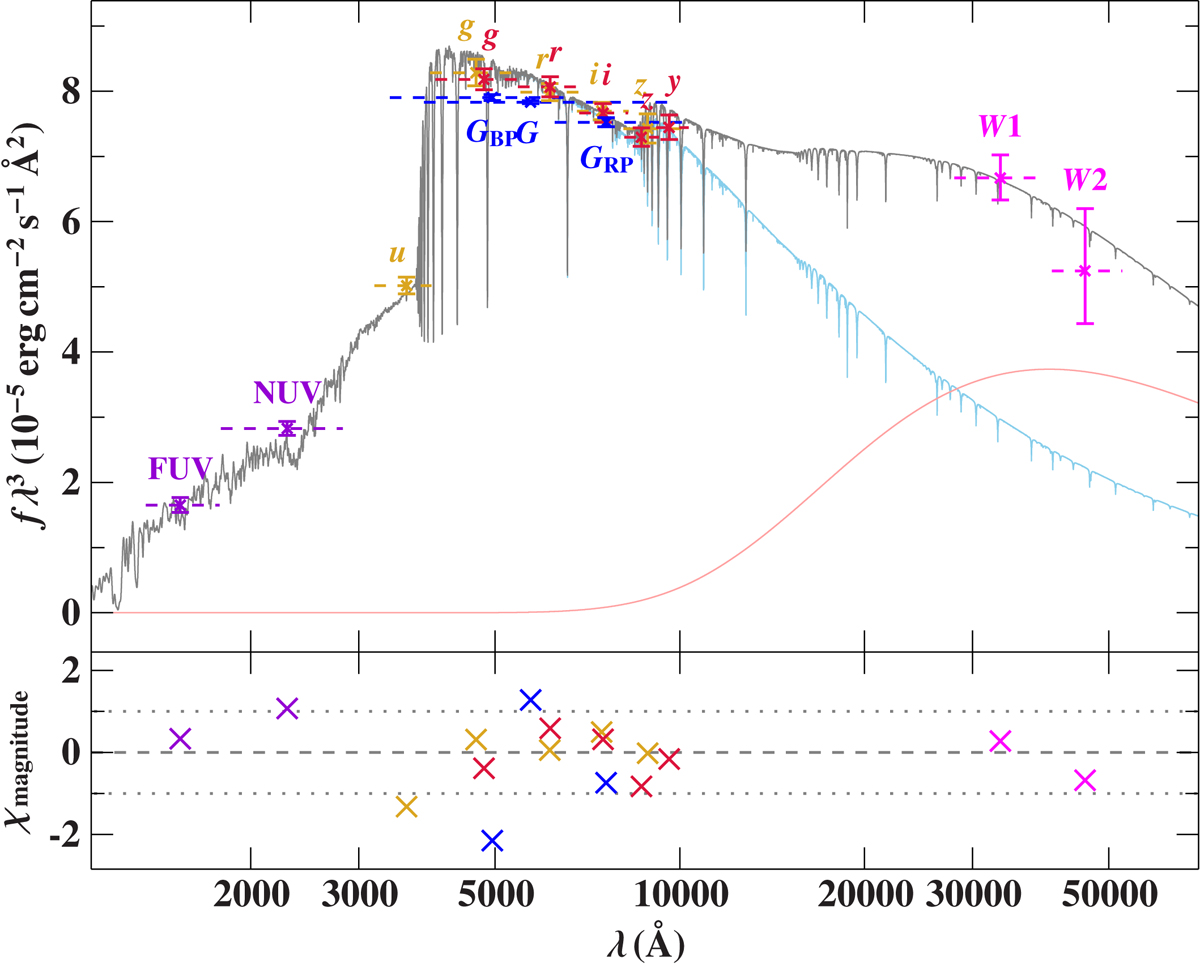
Comparison of synthetic and observed photometry. The top panel shows the SED. The colored data points are filter-averaged fluxes that were converted from observed magnitudes (the respective full widths at tenth maximum of the filters are indicated by the dashed horizontal lines), while the solid gray line represents the best fitting model, i.e., it is based on the parameters from Table 3, degraded to a spectral resolution of 6 Å. The flux is multiplied by the wavelength to the power of three to reduce the steep slope of the SED on such a wide wavelength range. The individual contributions of the stellar (light blue) and blackbody (light red) components are shown as well. The bottom panel shows the residuals, χ, that is, the difference between synthetic and observed magnitudes divided by the corresponding uncertainties. The photometric systems have the following color code: GALEX (violet; Bianchi et al. 2017), SDSS (golden; Alam et al. 2015), Pan-STARRS1 (red; Chambers et al. 2017), Gaia (blue; Riello et al. 2021), and WISE (magenta; Schlafly et al. 2019).
Current usage metrics show cumulative count of Article Views (full-text article views including HTML views, PDF and ePub downloads, according to the available data) and Abstracts Views on Vision4Press platform.
Data correspond to usage on the plateform after 2015. The current usage metrics is available 48-96 hours after online publication and is updated daily on week days.
Initial download of the metrics may take a while.